Today's event is led by Rustam Farrakhov, Director of Product Development Department, InfoWatch company. He began his speech by saying that he is ready to talk about predictive analytics, i.e. about the possibility of applying this approach when working with threats. The option when intentional and unintentional violations are detected and recorded after the fact, this approach can be considered obsolete. This is not what is expected from information security services. Timely identification of risks, their minimization and elimination are expected.

When it comes to preventing leaks, the task of controlling and blocking the channel comes to the fore; the more channels we can control and block, the more effective it becomes overall.
However, channel control is one side of the issue, but the DLP system has limitations. First, the number of channels is increasing. If we talk about intentional actions on the part of an intruder, if he is quite resourceful, he will find a way to bypass the DLP system and remain unnoticed and commit a violation. A person who is an offender may not have malicious intentions; he may inadvertently commit some actions. This subject has some motives, interests, actions, and certain behavior. We are trying to identify in his behavior signs of an impending or potential violation. This can give a significant plus, because it will signal in time and provide ground for analyzing a future leak.
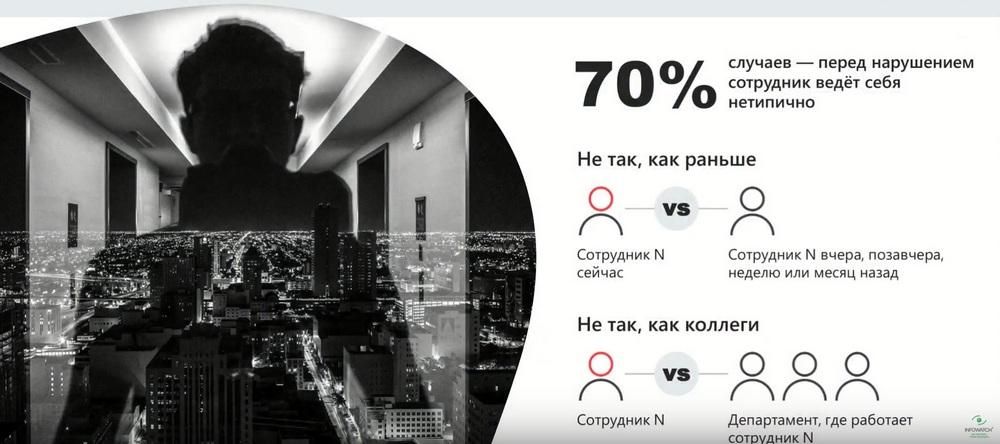
The offender often has some motivation, and it can also be identified based on an analysis of his behavior. In 70% of cases, before a violation, an employee behaves somewhat differently; there are certain signs in his behavior; there are certain anomalies relative to his own actions in the past or relative to the group in which the employee is located.
This can be a group within the company or a department, a division. Behavior analysis can provide serious advantages in the fight against leaks and incidents.
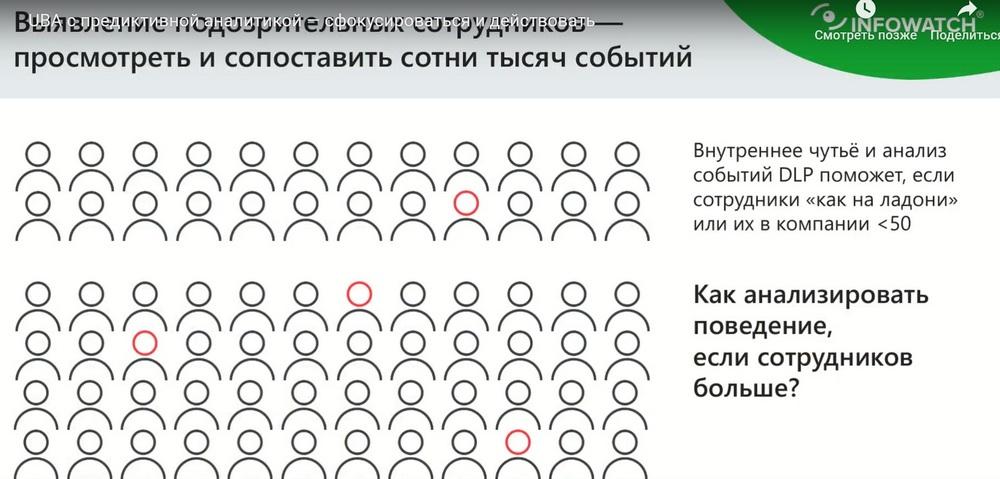
What are the signs of suspicious behavior? An experienced security officer has certain experience; he uses certain approaches that allow him to find correlations and action patterns in the stream of events based on certain signs, which will allow him to draw certain conclusions. But a very small list of employees has such experience. When the number of employees monitored by the information security department becomes hundreds or thousands, the number of information security specialists does not grow proportionally to the number of employees in the company, so analyzing with the eyes becomes impossible.
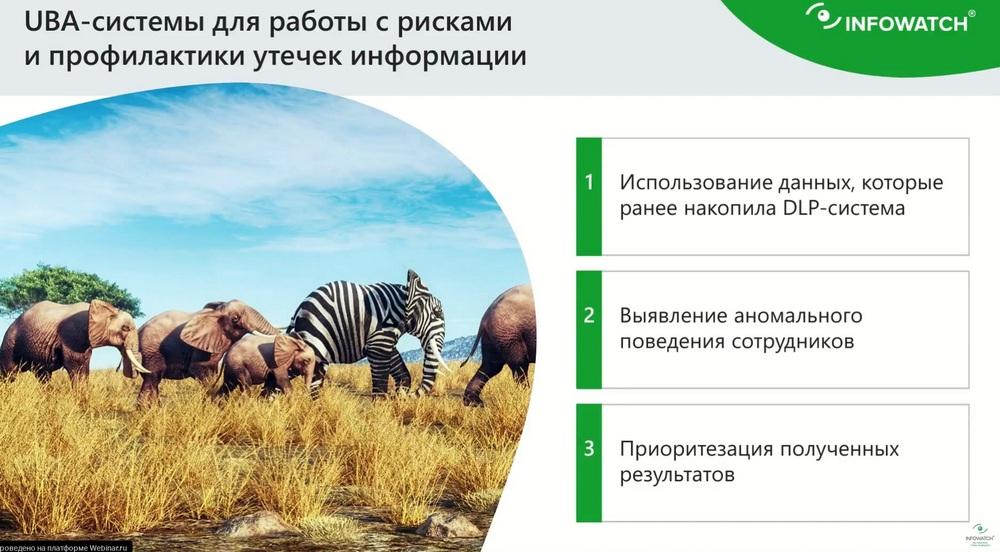
For this, specialized solutions of the UBA (User Behavior Analytics) class are needed. This is not a new abbreviation for you. Everyone has somehow touched on this topic, because, as a rule, UBA systems come as an additional extension, an additional feature to systems that provide collection of DLP systems, SIEM systems, or some other class of solutions that gives some base, some peak data, on the basis of which analytics can be built. And UBA systems generally work in a similar way. They share common principles. This is the availability of Big Data, i.e. a large array of data that is updated on an ongoing basis; data is constantly collected and filled. Based on this data, using various algorithms, certain mechanics are built to identify either deviations from the norm or to find some correlations or patterns. And, accordingly, the security officer is provided with a tool for working with the analysis results. These can be dashboards, reports, some user notification tools.
Not all UBA systems are equally useful. And often when communicating with users who have tried such systems in real life, you can hear some comments. If we generalize, the disadvantages are more or less uniform for UBA systems.

Firstly, this is bias, or rather inaccuracy, in determining certain signs. This is due to the fact that a limited list of data is used.
For example, if we use data exclusively about communications, i.e. the content of correspondence, this may not give a complete picture of what is happening with the employee, how he acts, how his behavior changes. Secondly, often the UBA system is built on rigid logic. And if we are talking about the fact that UBA allows, for example, to find deviations from norms, then norms can be set by rigid thresholds. The most obvious example. Let's try to find employees who work on a non-working day. To understand that an employee is working on a non-working day, you need to set threshold values: 9:00 - the beginning of the working day and 18:00 - the end of the working day. If the user's activity deviates from this time interval, this is recognized as a deviation from the norm. Given that companies are quite dynamic, processes change, employee actions change, the employees themselves change, maintaining the relevance of such models on an ongoing basis is an almost impossible task. And, as a rule, in this case, the system simply dies because it cannot adapt to changes. And thirdly, the UBA system does not provide the level of opportunities to use the analysis results in such a way as to solve the primary task. The first task is to timely identify a potential or obvious active violator with the required level of accuracy. The UBA system can provide some reports, data slices, but in order to draw some conclusions, additional efforts are required. And this received information does not always solve this problem for the user.
And our approach to building UBA is slightly different. Since our product is quite young, we have taken into account some of the disadvantages. We have taken into account the opinions of users and customers who have already used such solutions.
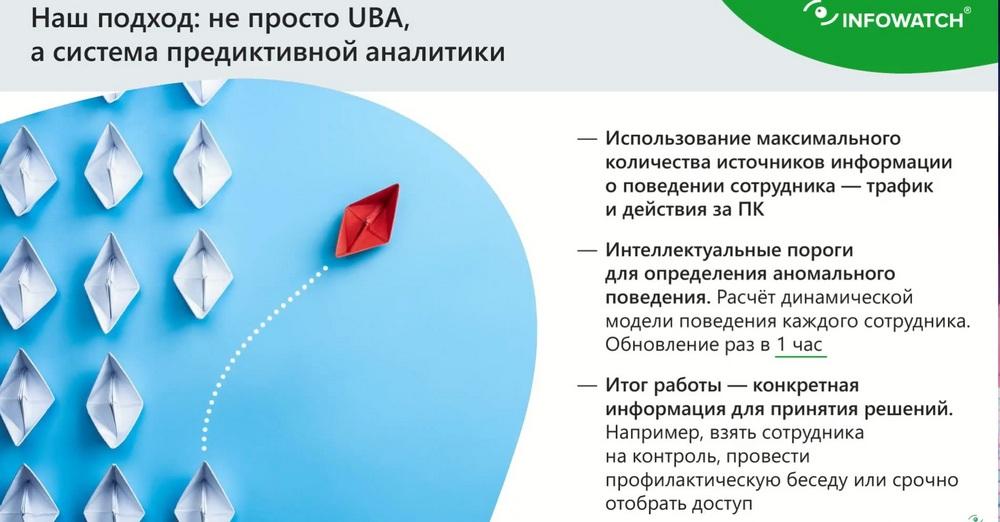
Our UBA system is built in such a way that it can use any data at the input that can be digitized and to which a statistical approach can be applied, i.e. to obtain some measurable indicators from them. And now we have at our disposal data not only about communications, i.e. DLP data, but also data about the actions of our employees, which the system receives from the activity monitoring system. Thus, the coverage of what is happening with the employee is expanding. And the wider the coverage, the higher the accuracy of identifying signs of violations.
Earlier I said that for many people the system has a significant disadvantage. We have taken this moment into account. And the key feature of our system is that it is based on machine learning algorithms, and this allows us to ensure the flexibility and adaptability of the system to changing processes within the company. The system is in the process of continuous learning. Thresholds are set individually for employees, and they are dynamic. Over time, the thresholds may change in one direction or another when the system understands that the norm has changed. An example with working hours. It may happen that for some reason the time intervals shift in one direction or another, i.e. the thresholds for determining the norm shift. But this does not mean that everything is so complicated and unpredictable. In principle, InfoWatch Prediction can use a combination of vaguely defined thresholds with clearly defined thresholds and set the weighting in this.
And the third aspect is that we aim to ensure that InfoWatch Prediction closes the main task, i.e. to timely identify potential violators, to do this with the necessary level of quality and accuracy. And InfoWatch Prediction provides this opportunity thanks to a well- thought-out interface and the tools that allow the user to interact with the system.
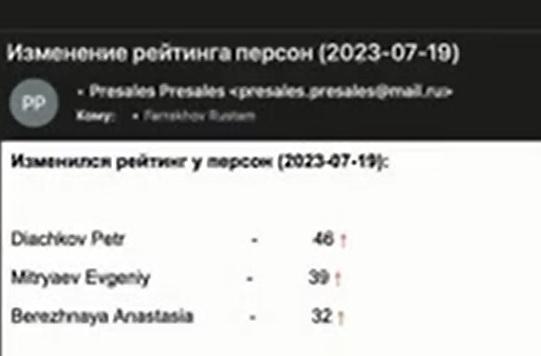
Let's move on to the Demo. Let's start with the fact that InfoWatch Prediction is an analytical system. From the name UBA (User Behavior Analytics) it is obvious that the system is designed for analysis. Another task that we want to solve is to minimize the labor costs of the security officer and provide him with such a mode of operation so that he is not required to constantly monitor the console. And one of these features, which is simple and obvious, is notifications. A notification system with the ability to configure rules for informing security specialists. The screen now shows an example of such a notification.
It is extremely minimalistic. It contains information about which employees have experienced a jump in risk level, a jump in rating. We see that there are only three of them. These are the employees that the security officer should pay attention to. And, upon receiving such a notification, the security officer goes to the InfoWatch Prediction console, and there he can get a complete picture of how risk levels are distributed across the company, i.e. such points are digitized for employees.
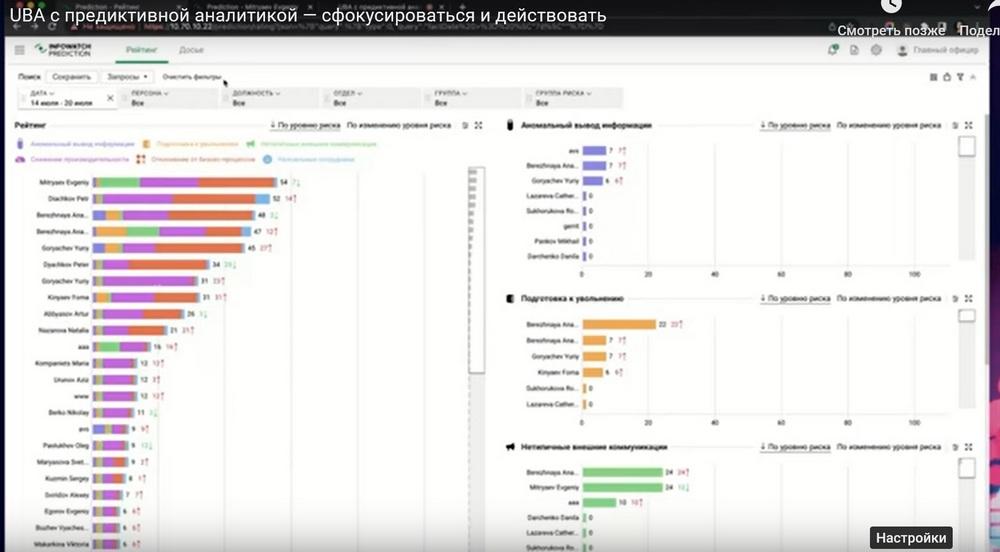
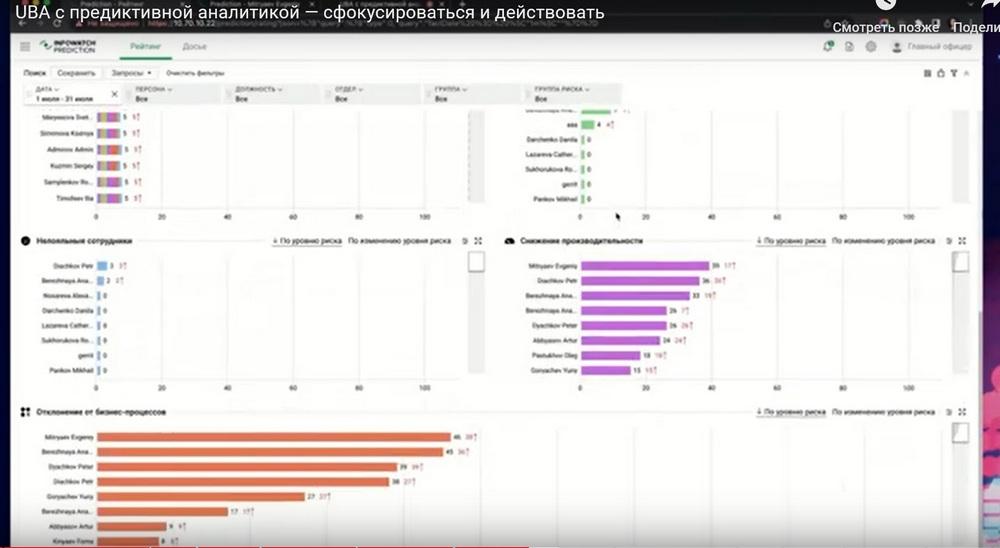
We see confirmation that we really have three employees who fall into the top in terms of changes in risk level and overall risk indicators. These are Evgeny, Anastasia, and Petr. Next, in order to understand what this risk indicator is made up of, we can look at the decomposition by disk circle six, which I called. For Anastasia , we see a jump in the risk of anomalous information and preparation for dismissal, for Evgeny, we see atypical communication, deviation from business processes, and decreased productivity.
This is a less obvious factor, but we can also go to Evgeny's dossier in order to get more detailed information about why his rating in these risk groups has increased. We can apply a filter for atypical external communications and look in more detail at what these communications are. We can go to the content of the message, i.e. conduct a detailed investigation.
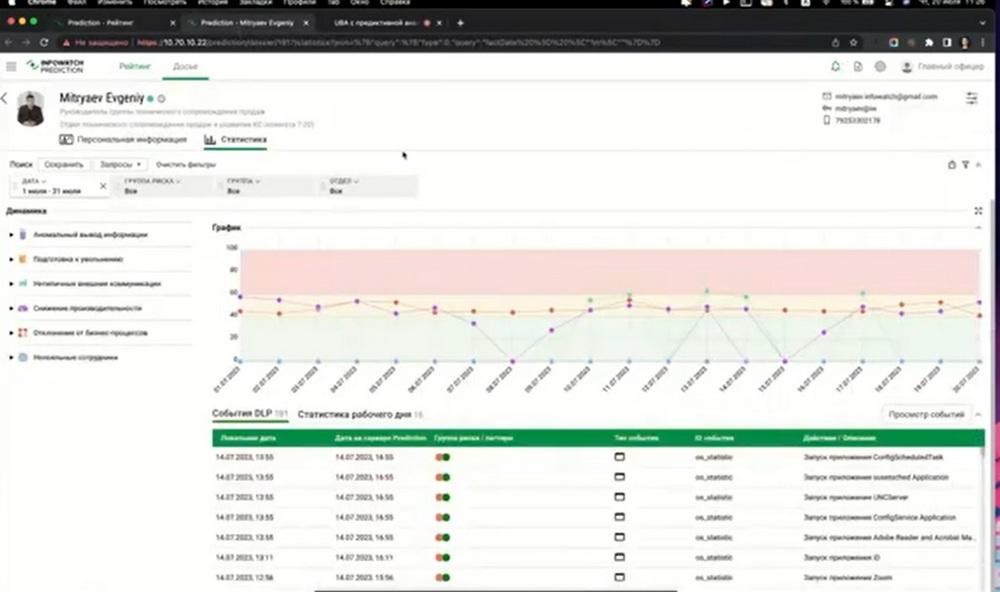
Deviation from business processes is, as a rule, the use of atypical applications. And here we can see what these applications are and at what time they were opened. And based on this, we can draw conclusions, InfoWatch Prediction even without the activity monitoring module, already gives a fairly complete picture in order to draw conclusions about a specific employee.
Now in order to train the system, you need some array of data collected over a period of time. Now we have 28 days or 4 weeks. This is a cycle with an unchangeable number of days off. This period is taken as some sufficient one in order to train the model on some recurring actions of employees, and this is enough to establish and determine the norms of behavior and then to identify deviations from the norms.
The dashboard is now minimalistic. Here you can apply filters by employees, by period, by risk groups in order to narrow down the amount of information. Some additional tools to view the dashboard in different sections of information, we deliberately do not do. We simplify the user's work.
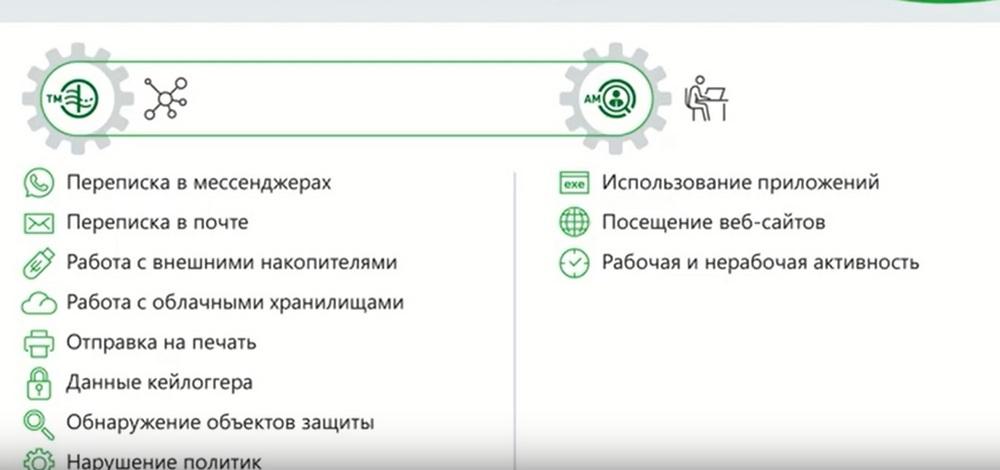
InfoWatch Prediction uses not only communication data. The algorithms are built to allow the use of any data. In addition to this, data on user activity, working time, activity time, application usage, website visits are used, all this is taken into account, and in aggregate. All these aspects related to user actions are collected into certain combinations that represent patterns.
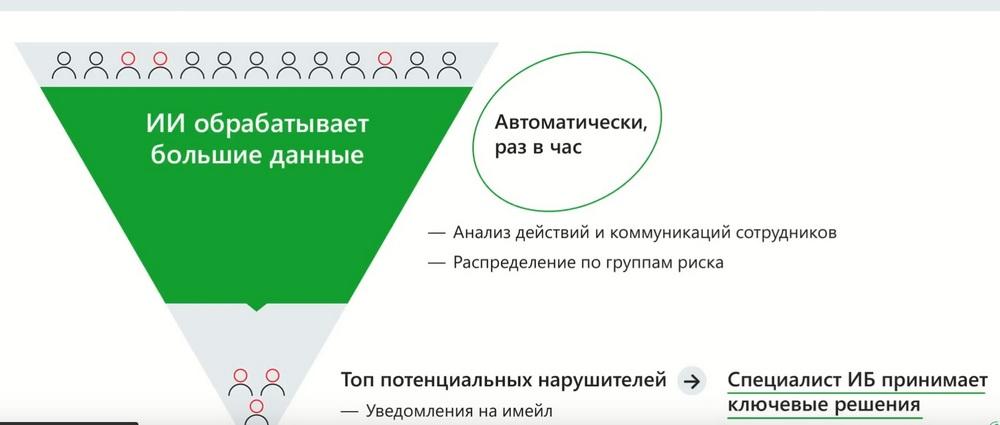
We have a certain number of employees who generate events. Data is formed from these events. InfoWatch Prediction updates analysis results every hour. InfoWatch Prediction is trained, analyzed, and ratings are updated every hour. Distribution and redistribution of employees by risk groups. At the output, we get a doc of employees who are ranked based on the level of risk, and the security officer receives this information either by logging into the console or in an email notification.
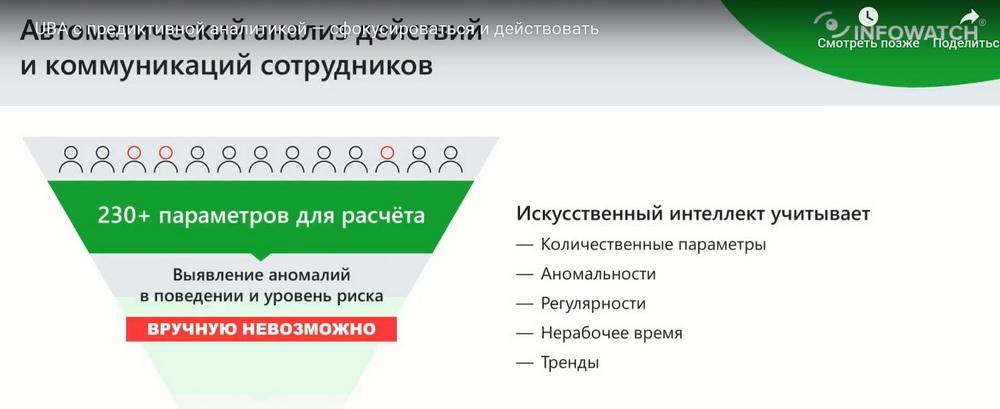
The data that is analyzed is digitized. Parameters or statistics are extracted from them, i.e. some measurable indicators. Moreover, what is important is that these are very different aspects, not only quantitative indicators, such as the number of sent emails or the amount of data transferred somewhere, but also other options. Frequency, regularity, time indicators and most importantly, trends that allow us to predict what actions may occur in the future can be taken into account here. What actions are considered normal, and which ones may become abnormal in the future.
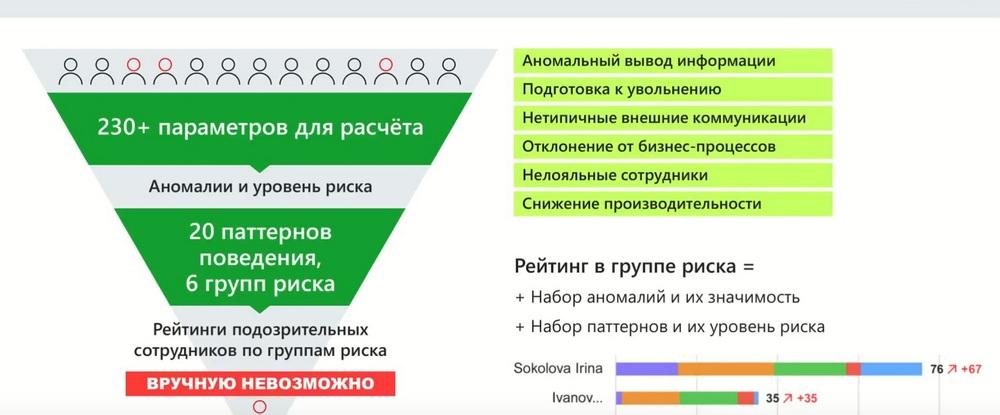
Based on more than 230 parameters, certain combinations are created that form patterns, and risk groups are formed from them. We have seen these groups, there are 6 of them now. And the plans are to expand both the number of patterns and the number of risk groups. And then users receive a simple visualization of how patterns and risk groups are distributed among employees.
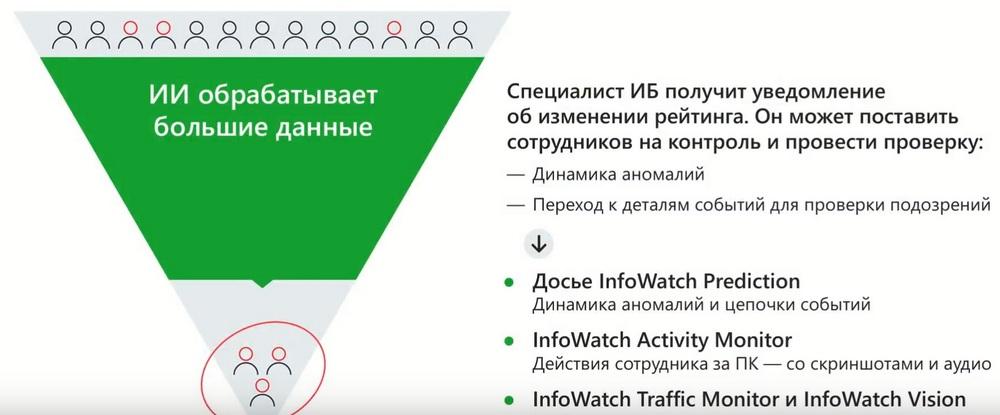
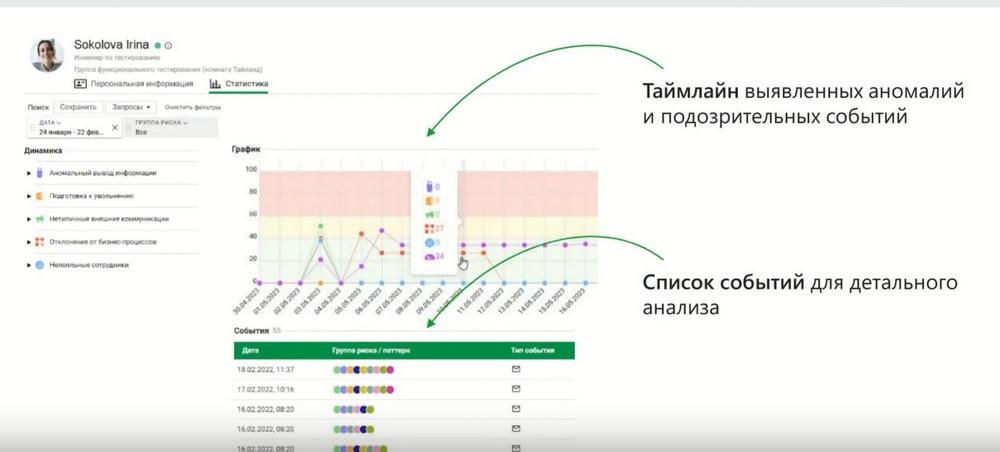
As a result, InfoWatch Prediction solves the main task mentioned above. This gives triggers for the security officer to get involved in time, and in time he could understand what to pay attention to. And then he would have the opportunity to conduct a more detailed investigation. If the data provided by InfoWatch Prediction in its interface is not enough, and it provides an event display in the form of a timeline, i.e. in a time series we see all events on a scale indicating the level of criticality or the level of risk for this event, and, accordingly, visually we can immediately understand in which events it is worth digging and looking in more detail.
If this data is not enough, we have an employee activity monitoring system at our disposal. This system provides a deeper dive into what the employee was doing. That is, in addition to statistical indicators about working time, about which applications were opened, which resources were visited, there is also the opportunity to look into what was happening on the workstation, because there are screenshots, there are recordings from the microphone, there are records of file operations.
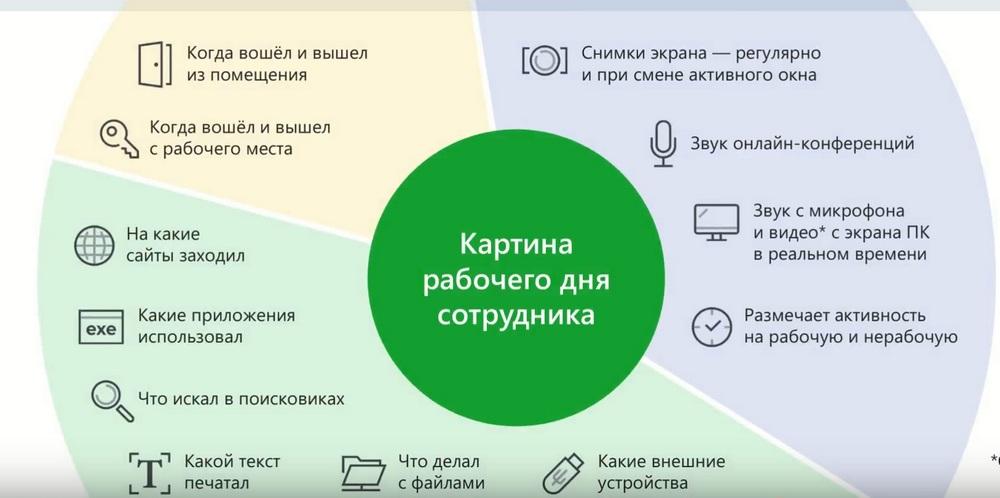
And you can understand with a high level of detail what was happening during the employee's working day. If you need to expand the context and see, for example, what was happening with some confidential information or with whom the employee was interacting, then the security officer has a mode that provides all the tools.

There is a communication graph that allows you to track all communications, there is the ability to track how and along what route a particular file moved, etc. using different filters and different visualization methods. There are more options for use ... there are quite a few ways to analyze.
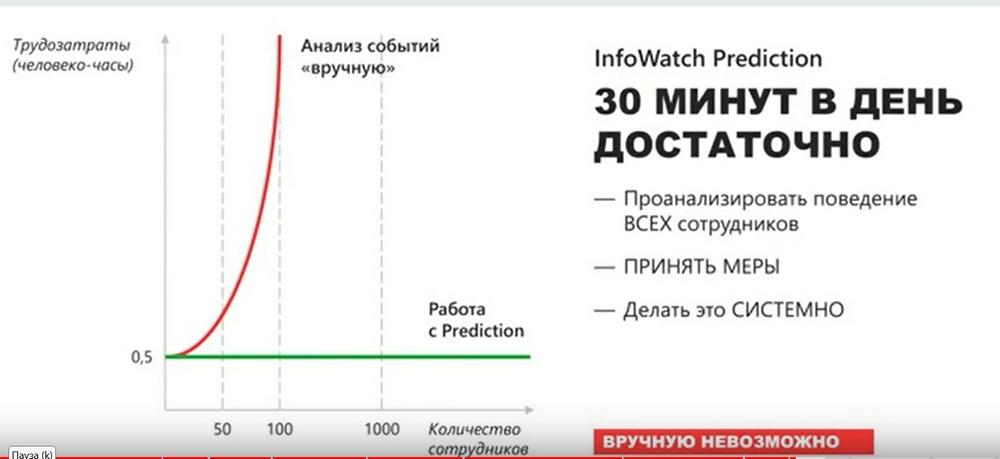
The key value of InfoWatch Prediction is that it dramatically reduces the time and attention of the security officer required for his work. In fact, it is enough for him to turn on the notification setting, understand the system, and then InfoWatch Prediction systematically performs the task of monitoring what is happening with employees, how their behavior is changing, and promptly signals the security officer about certain changes. This serves as a starting point for the security officer to thoroughly understand the situation and make an appropriate decision.
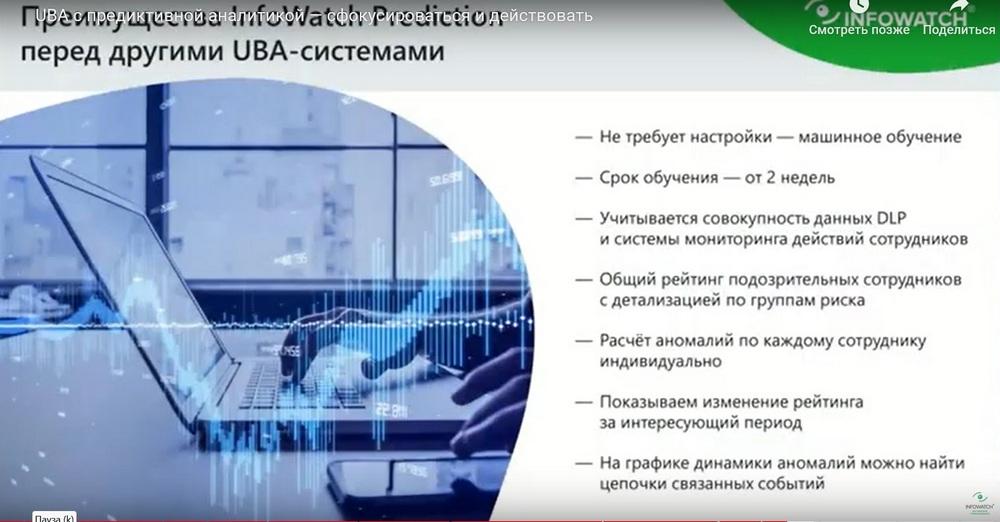
InfoWatch Prediction is built on machine learning algorithms, which means that minimal settings and minimal methodological support are required. Its training period is 4 weeks by default, but it can also be from 2 weeks. This is a regulated parameter. But we recommend 4 weeks in order to ensure the most reliable data. This allows the user to understand the situation and take the necessary actions without complex objective burdens.
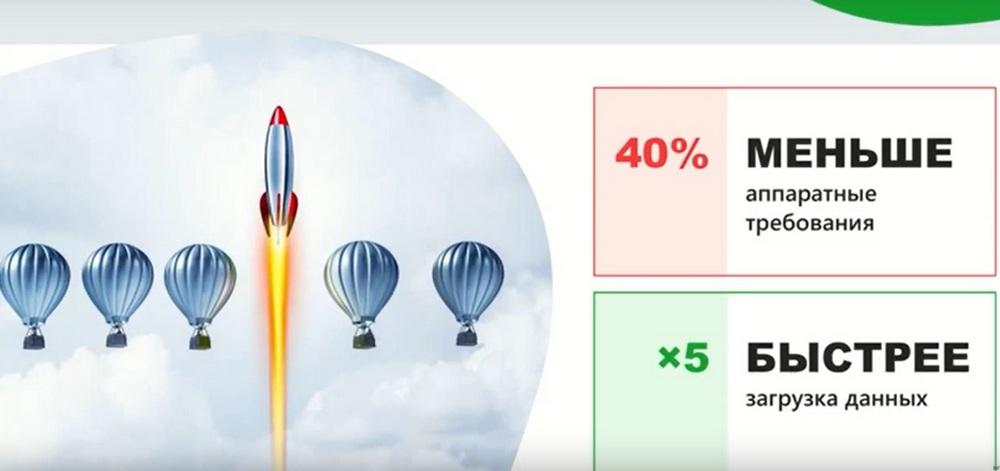
Now about what's new in the latest version of InfoWatch Prediction 2.3. And the most important changes that appeared in this release are increased performance and reduced requirements for hardware resources. InfoWatch Prediction has become less demanding and faster. Data is processed faster, statistics are calculated, and less hardware is required for InfoWatch Prediction to work. New features have appeared. A new pattern has appeared in the risk group abnormal information, the pattern of using mail on the phone.
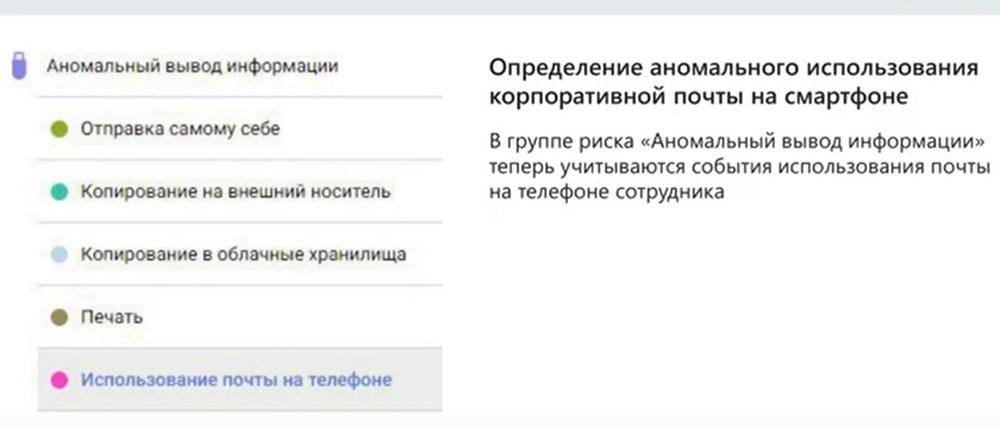
I'll tell you a little more about what it is. There is such a channel of potential leaks, which is not so often paid attention to, this is the ability to synchronize corporate mail from a mobile device. Often in companies this method is allowed, it is legitimate. And an employee, in the case when he is legitimately working with mail, viewing, say, 10 letters daily, and at some point starts downloading mail for a year with all attachments. This means an anomaly in how he usually works. InfoWatch Prediction detects such an anomaly and highlights it in the risk group abnormal information output. That is, potentially an employee can do this in order to take this information outside the enterprise. And this can be considered a risk of leakage.
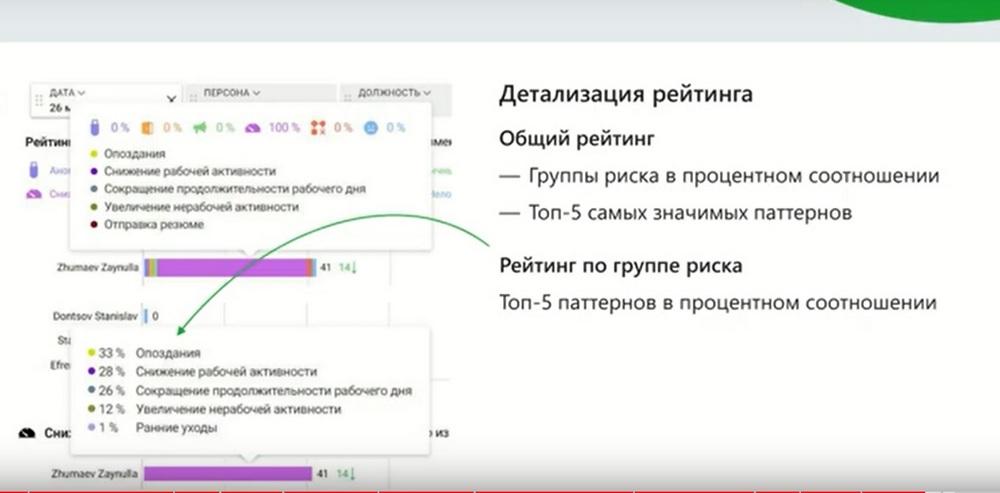
We have added informativeness to the main dashboard on ratings. Now, for each indicator of the risk group, you can see information in the form of a tooltip about which patterns the risk was formed from, and what indicators for each of the patterns. That is, we see specific numbers, and for us this increases transparency and understanding of how the rating was calculated. We also added visual levels to the timeline, which allow you to quickly navigate to which event in this time series you should pay attention to in the first place. That is, red is those events that are critical.
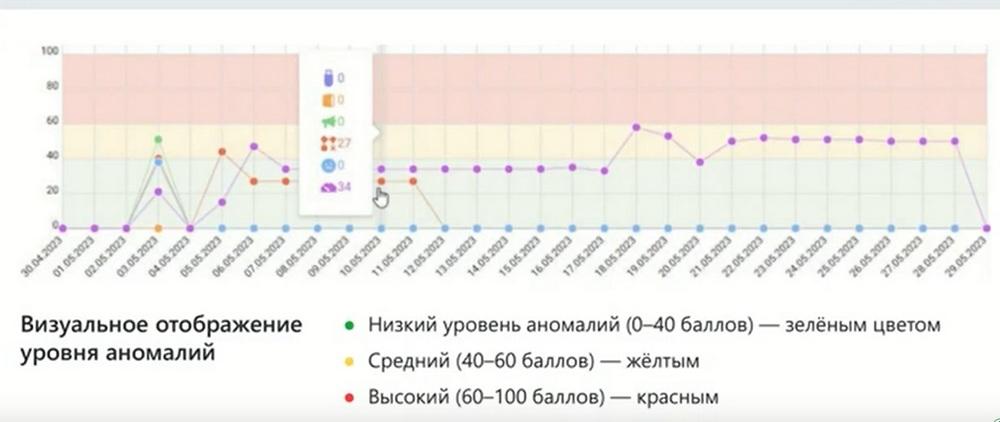
We have plans to implement such an event dashboard. Its meaning lies in the fact that those patterns, i.e. signs of risk groups, which are at our disposal, we decompose into stages. We follow the assumption that a violation is preceded by a series of signs that can be decomposed into sequences. An employee who is preparing to take away information has a motivation, or, if an employee is negligent, he has signs of incorrect handling of information, and then there may be actions to prepare for a violation, etc. That is, there is some sequence. And, displaying the signs in such a sequence, highlighting a high level of risk in red, medium in yellow, and low in green, we can more qualitatively understand what is happening, by what signs we can judge that there is a real risk of leakage or some other violation.
In addition, there is another visual analytics tool, it can be called a star, or a radar. This is a visualization method that allows you to compare indicators for the patterns of a particular employee with his colleagues. That is, to overlay one picture on another in such a distribution in order to understand how much the employee differs from his colleagues, which can also provide additional information for conclusions on a particular employee.
And, to summarize, I would like to say once again that we strive to solve the real task of security officers, to give them a tool that will tell them which employees to pay attention to, provide specific data, specific evidence, thereby reducing the burden on the security officer and on the security service as a whole. Of course, you can feel the full power of the technology by applying it in your organizations, on your employees. Therefore, leave applications for pilots, based on the results of the pilots you will be able to better understand and evaluate how useful this "thing" can be in your work.