This event introduced a new tool for cybersecurity incident investigations - an interactive timeline of employee actions, unparalleled in the market, and other new features for online monitoring and retrospective investigations that have appeared in the InfoWatch Activity Monitor monitoring system.
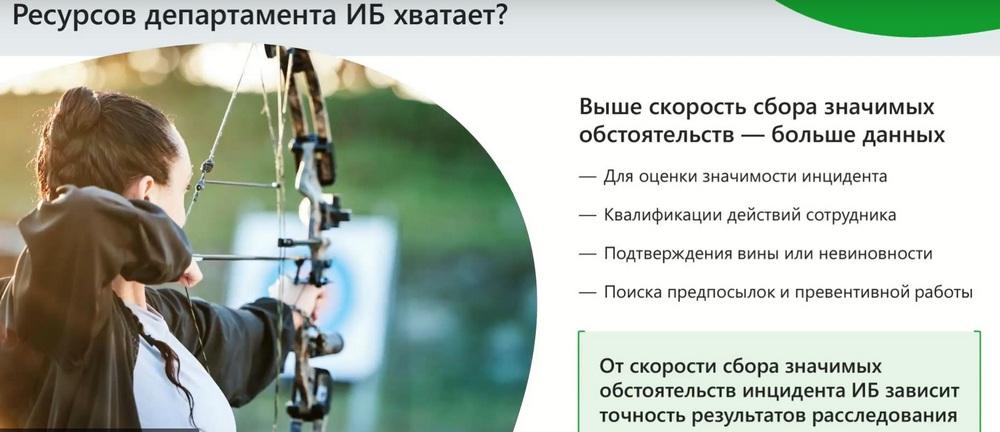
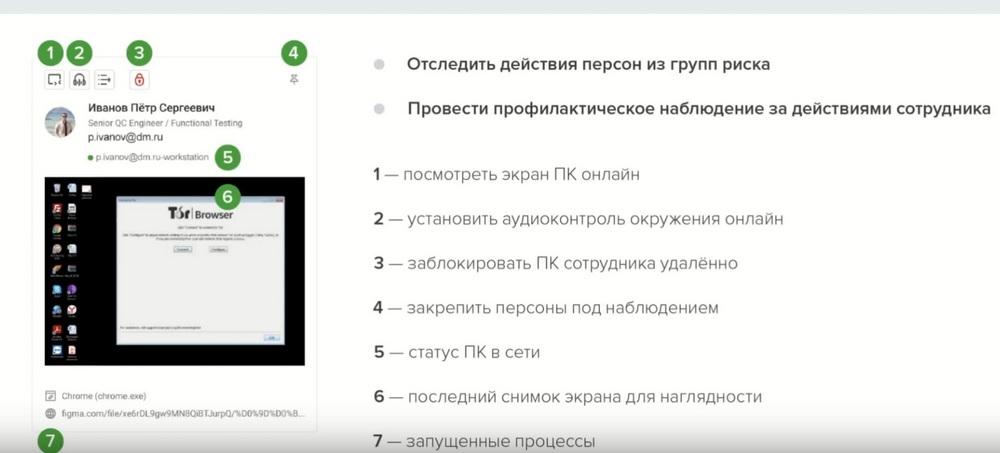
When time for investigation is limited, the completeness of the data used to qualify an employee's actions depends on the speed of gathering all significant circumstances of the cybersecurity incident. This means the accuracy of the entire investigation. You can look for answers in a tabular event feed. Or you can improve efficiency by using a clear timeline of employee actions: see the chronology of events and the context of the incident on an interactive timeline, with the ability to delve into any details. Today, we will learn how to quickly reconstruct the sequence of actions an employee took before, during, and after a cybersecurity incident. How to prove involvement, malicious intent, or innocence, identify the prerequisites of a cybersecurity incident, and gather evidence. Enhanced online monitoring and real-time employee activity monitoring capabilities with the ability to connect to a PC screen, analyze process lists, and block a user's session.
Today's event is led by Sergey Kuzmin, Head of InfoWatch Employee Monitoring.
Sergey began his presentation with the introduction of new cybersecurity tools that can aid in incident investigation. Let's see how this area has evolved using communication tools as an example.
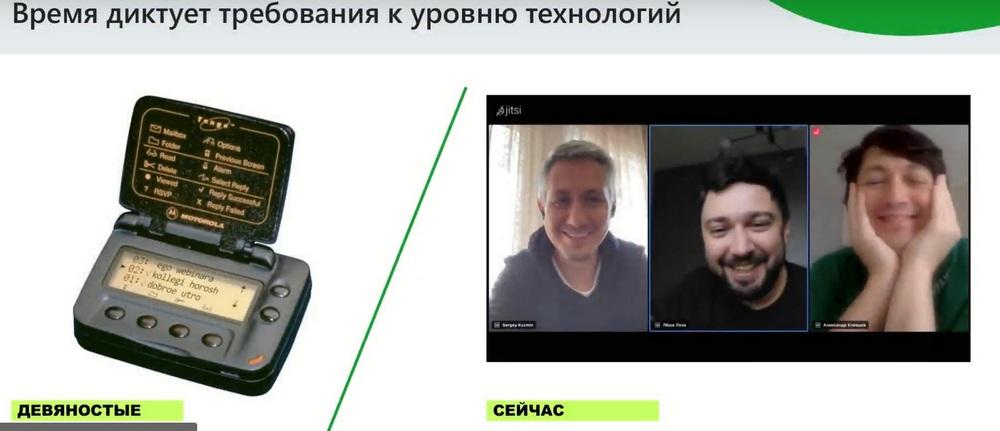
In the 90s, communication tools such as pagers or early mobile phones were the height of progress, but now the absolute routine of work is the use of mobile Internet and video communication. The same level of technological development is happening now in the field of information security. Tools that once seemed unshakable are also transforming.
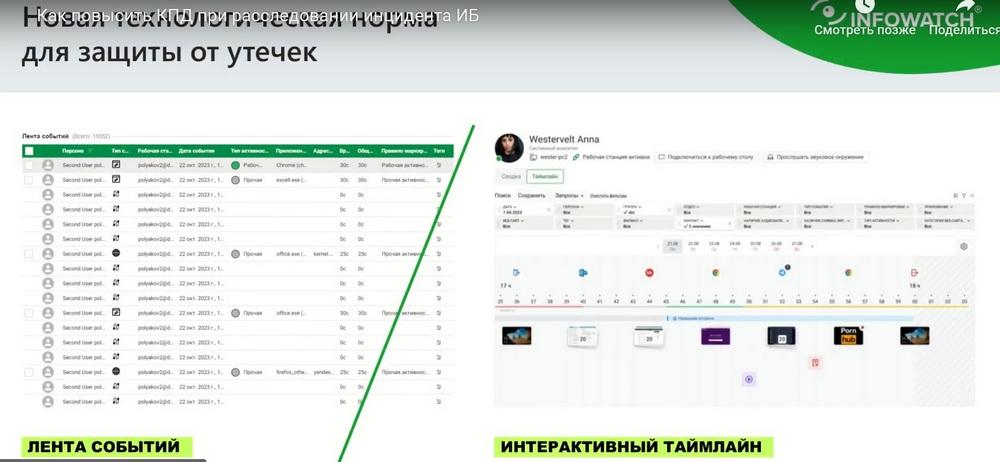
The interactive timeline should also give a serious boost to the development of cybersecurity and initiate serious progress in the investigation of cybersecurity incidents. But, if we compare it to the existing work paradigm in the market, we see that it involves working with events, analyzing streams of tables and event feeds to detail the sequence of actions a person takes when investigating cybersecurity incidents. The standard pattern of our work is that an event has occurred, or we assume that something will happen, and we need to delve into this chronology of actions. If we talk about both the DLP system and the Play Monitoring tool, it shows not only DLP events, but also all work activity and activity around the workstation in relation to the potential violator. In this case, we are considering the Play Monitoring tool, namely Activity Monitor in Infowatch as a tool for detailing and delving into the context of a cybersecurity incident. And we decided to look at this problem through the eyes of our users. We understand that manually analyzing a large stream of events is very laborious, and focus is lost quite quickly during such monotonous and complex work, often, unfortunately, even before the necessary facts and evidence of the incident are obtained. We believe that the same path that you have taken, and sometimes analyzing the event feed takes hours, can be completed in minutes or even seconds if you are provided with modern tools for quick searching and quick work with incidents. We realized that we have a huge amount of useful content related to an employee's work within the system. And we decided to place it on a graphical timeline.
We were prompted to do this by the understanding that the time for incident investigation is limited, resources are scarce, and everything comes down to speed and efficiency. We set ourselves the task in this tool to provide speed and time - those resources that are irreplaceable in any work. This is what needs to be saved, and in general, the entire modern technological world is pushing us towards this.
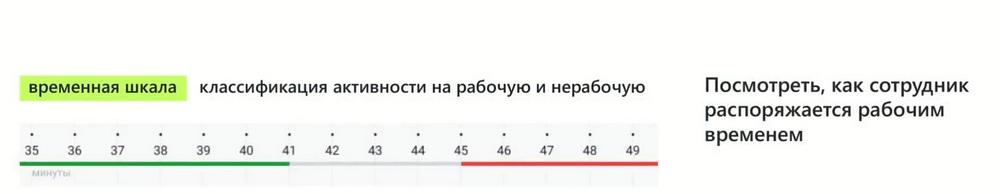
Let's look at what our initial inputs were. All Play Monitoring tools have a similar structure. This includes working time tracking, an event feed, and some minimal visualization, a timeline, where there is simply a markup, the simplest classifier depending on which application the person is in. How to classify this as work or non-work activity, or as some other types of activity? This was of little use for cybersecurity tasks, it was more of a story about reporting or some very special situation. We decided to make this a full-fledged tool that, along with other DLP system capabilities, many of you are familiar with and love our Vision module with its connection graph, and we set ourselves an ambitious task to provide you with another similar tool for daily work.
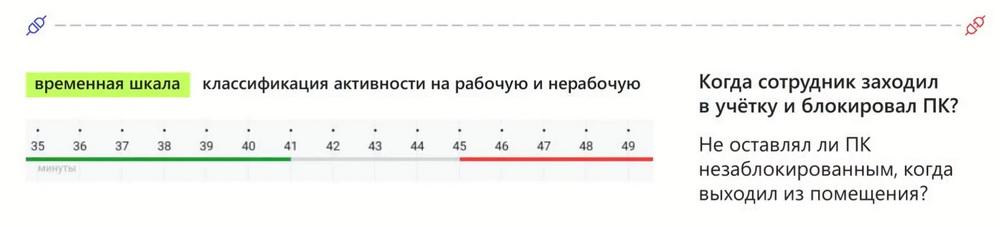
We started by determining what data we have. This is the entry and exit to the workstation. The timeline needs to add an understanding of when a person started and when they finished work, and how they logged in, whether they used a remote terminal connection, or whether they logged in locally. What was it: login or logout, lock or unlock, i.e., already at the first stage we can use icons and symbols to understand and reconstruct, visualize events. In a sense, if we make a comparison, we are providing you with something like an audiobook or video stream instead of a regular text or book tool in order to show the activity that a person was engaged in on the day of the incident. And the history of a person's logins and logouts will be immediately clear. In addition to the history of logins and logouts, probably 80% of everything that will interest us in this timeline is the use of applications and websites. Therefore, the next line is which applications and websites a person visited and in what sequence. Just look at the timeline, and we immediately understand in what order, where the person went and what tools they used.
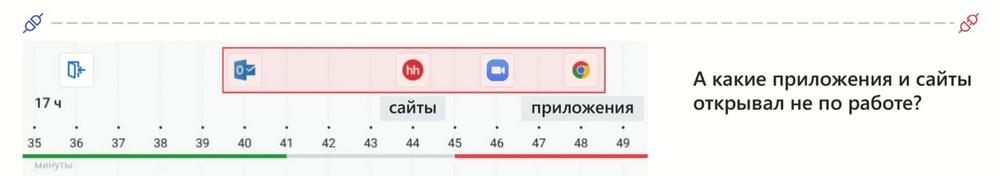
How can this be useful in incident investigation? For example, we understand that the incident occurred at 17:02, and it is worth checking what the person was doing 2 hours ago, and it becomes clear that the person used such and such applications, for example, file managers, such and such websites, for example, they uploaded information somewhere. Of course, mail, outlook, web versions of messengers, everything will be reflected here, this will give an understanding of the sequence of communication, working with files, or using web conferences.
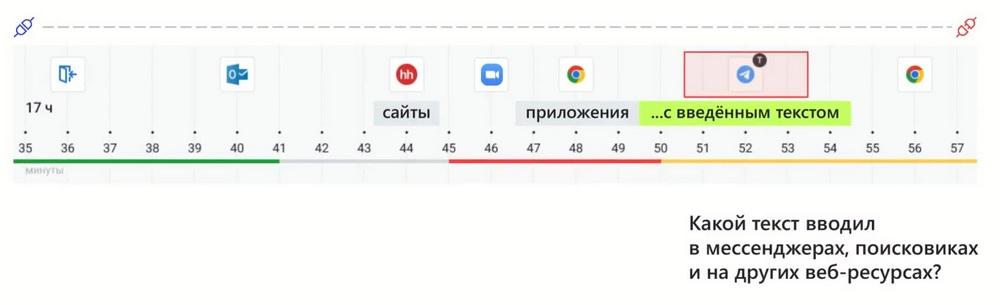
Events with entered text are marked with a special marker. I.e., in addition to using simple activity, when we use applications of websites, we will have events where there is attached text. The leitmotif of this entire tool is that you can focus only on what is important for your incident investigation and for detailing information.
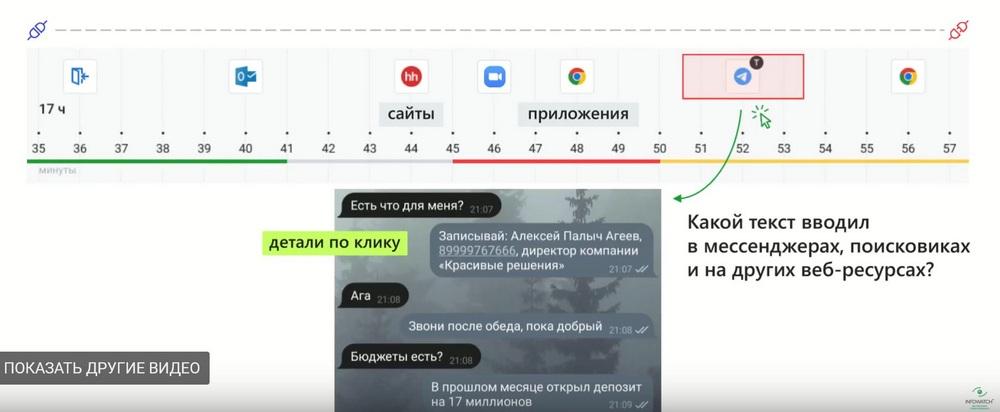
If they "went" to Telegram 2-3 times a day and looked at something, but only one of them is marked with the letter K, you can immediately see their correspondence. I see in the chat that Dmitry wrote "Better to screenshot immediately." Good point. We see that we will have another layer with file actions, the sequence of how and what was done will be visible.
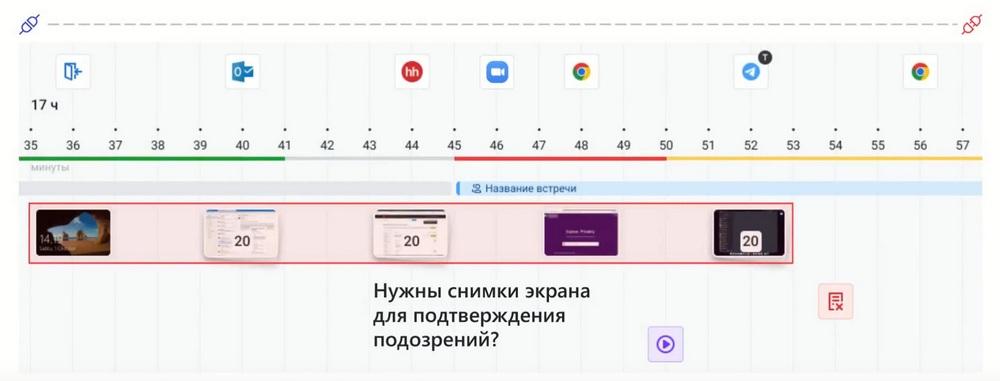
But we immediately discovered the benefit in the fact that the correlation on the timeline of applications of websites with entered text is especially valuable precisely when screenshots are presented on the same timeline. They are large if our scale is large enough or single shots if we are analyzing a small segment where we need a sequence of work. Thus, we will get not only the entered text, but also the context immediately. I.e., in the previous screenshot, it will be visible in which application they were working before entering, for example, Telegram, we see the text itself in Telegram, and at the same time, as a bonus, we see the context.
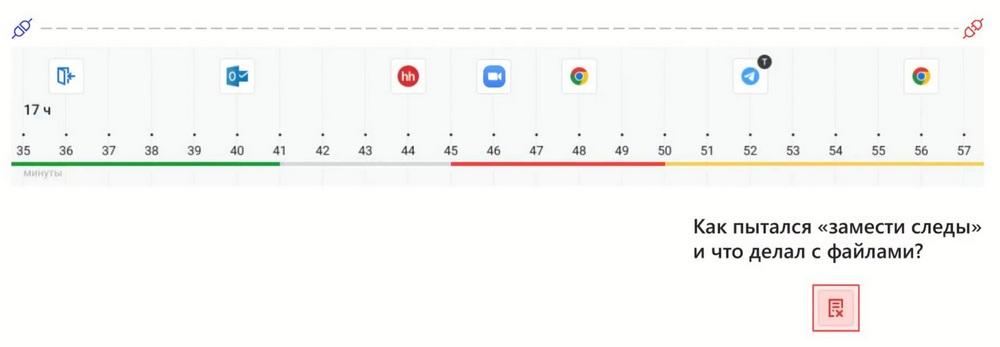
I'll go back to show other layers. The sequence of actions with files is the same. It is very important that the applications and websites used can be associated with file actions, and any saves, moves, or deletions of files are also superimposed on their own time level. And the same sequence, if we are interested in some incident related to files, will also be visible.
It is very
often required to correlate a person's work activity, their potential intent
of the incident with some of their meetings. For example, a person may share their screen during a video call, this may also be related to information leakage, through
screenshots, the use of applications. And that meeting from the Outlook calendar, to whom and how something was demonstrated by the person. Here we can combine several things into one, and understand in
all angles how we can look at the problem or the point of the incident. And,
in addition, collect interactive evidence. Because it is one thing
when, for example, management submits a report in the form of a series of events, some
list and comments to it, then here a screenshot of a correctly formed
segment will even help management quickly understand what the essence of the
incident was, if it is considered substantively.
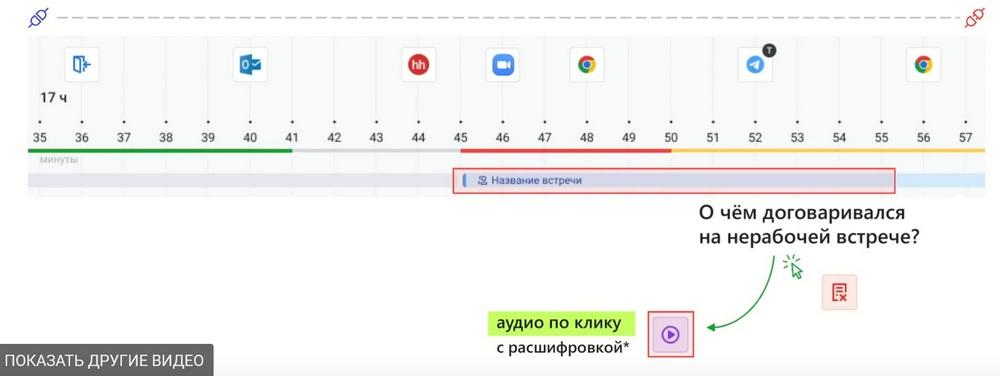
Here is a continuation of the same thought, that understanding simultaneity and presenting simultaneity of audio recording, for example, if it was some meeting, and audio recording was set up by trigger or in general, if employees under observation were listening to it, then we see that if an audio recording is attached to the meeting, then it can be listened to immediately. We also have screenshots to understand what sites the person was moving around and what they were looking at during the audio recording. And also, perhaps, they entered some text that may interest us. We have all the tools for "microscopic" research.
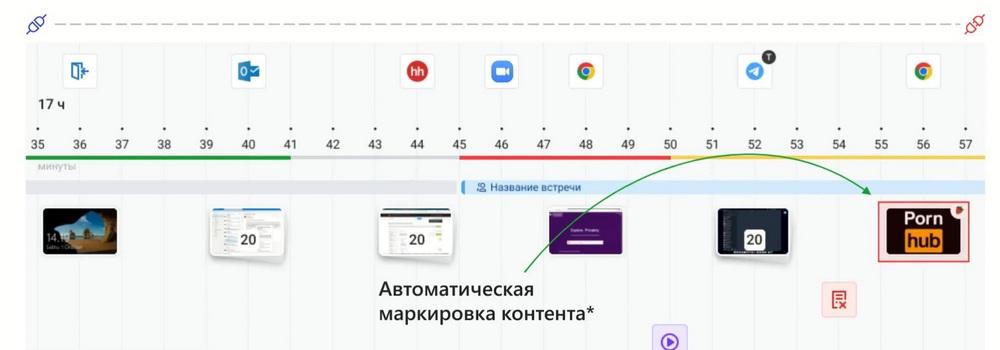
As a result, we have all the content located on the timeline and answering the tasks of targeted detailed investigation of a cybersecurity incident. In addition, we recently presented the first version, a prototype of our novelty. We will mark content in screenshots with certain labels. We took our technology as an example, which can analyze screenshots and mark the presence of indecent content. Such as viewing pornographic and erotic content. And we set such a mark, which testified that such and such a person was viewing a website related to this topic. Or maybe in their correspondence there are links to such sites or images. We automatically highlight to the cybersecurity officer an additional risk, including reputational, for the organization in order for them to investigate what exactly was happening. I think that in the next release it has a chance to appear on the market. And we will develop it not only in such a specific perspective, but also in the widest set of automatic markup.
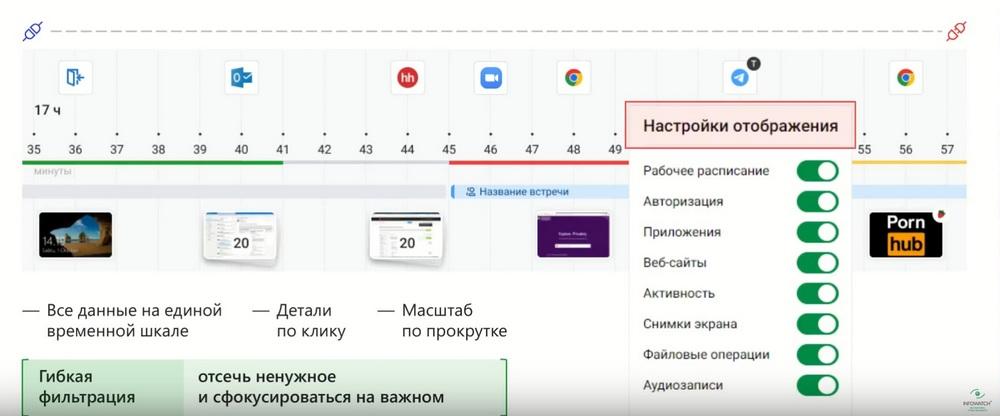
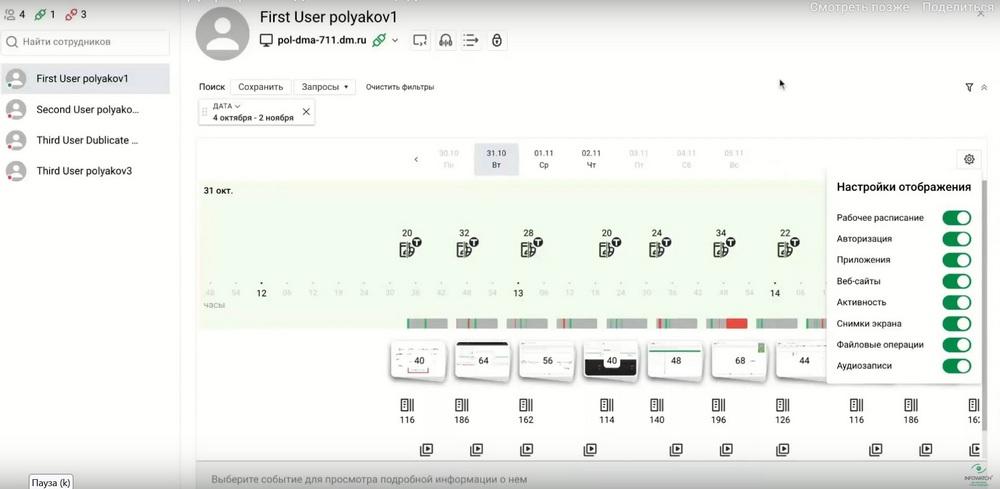
To summarize, all the layers that we have now sequentially gone through have two aspects. First, you can leave only the most necessary. If you are investigating a sequence of actions with a file, then applications may still be useful to you, so screenshots are also useful. But inputs and outputs are not needed. Or audio recordings of a meeting are not needed. You can easily remove or add the necessary layers so that you continue to focus, which we stated at the very beginning. We consider display settings an important part. But we consider filtering no less important. Leave only what is necessary if, for example, you sort by work or non-work activity. If you sort by a specific application, a specific website. Thus, this can be not only an investigation of an incident when you look at a time period and restore the chronology, but also a search for bottlenecks. For example, you can view, saving the filter for some application. How a person works with it, on what days, and leaving only what falls under the filter and only what is necessary, this will allow you to focus. And, of course, how this interactive tool works in terms of scaling and scrolling. An important aspect is prevention.
I will show that part of the toolkit on the demonstration stand, how it looks, and then we will return to the issues of preventive activities. And now we will visualize the work on the stand with the timeline toolkit. Here we immediately see the timeline, sorted by the use of a specific website.
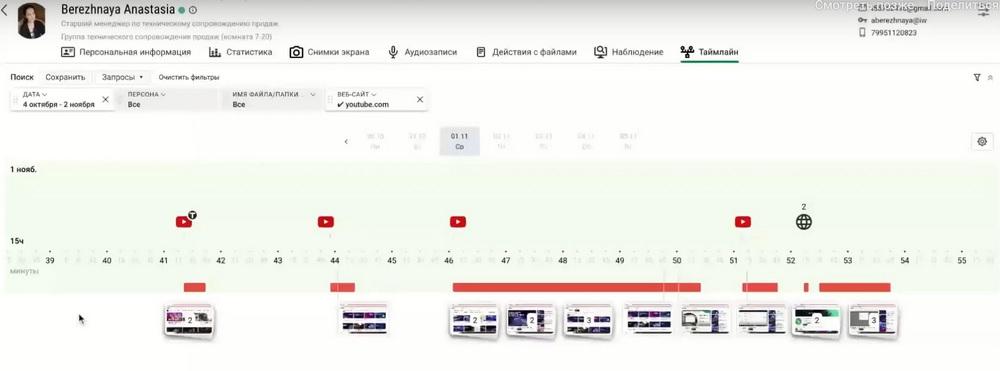
In the header, we see who this employee is. We are currently in the "dossier" section. There is also access to the timeline there. And we see a single filter that is applied to YouTube. We want to leave only those days and those events that are characterized by watching YouTube. Thus, we see that the employee watched this website and on the scale it can be enlarged to atomic events. Here we see that there are 2 events in the group. The same applies to screenshots.
You can go deeper to the point where each element becomes a separate event. Here we see that at 15 hours 41-44 minutes the person spent time on YouTube. And let's see, the extra layers are removed, only what answers my task. Work schedule on/off. Here it is on. Green color indicates that this happened during working hours. Authorization events did not fall under the filter, so they are not visible. I am not interested in applications. I am interested in activity. As you can see, it is red, not work-related. I am interested in supporting screenshots so that I can see exactly what the employee was watching on YouTube. And I also see that some text was entered. Let's detail this on a screenshot. I clicked on the group of screenshots, they broke down to two. And we see that the employee was indeed typing something on YouTube in the search bar. I can assume that this is the word "Infowatch" in the English layout. And the browser immediately translated it into the Russian name. The person was looking for our event. And let's look further. He had more events. The system recorded 6 seconds, then he spent 4 minutes on the YouTube site. Here he was browsing our webinars. The person was looking for, apparently, some specific webinar. And thus we see that I did not need to spend tens of minutes to look at each event. We just immediately see the sequence and study the person's work in YouTube. As you can see, I look at screenshots after each event that attracts my attention.
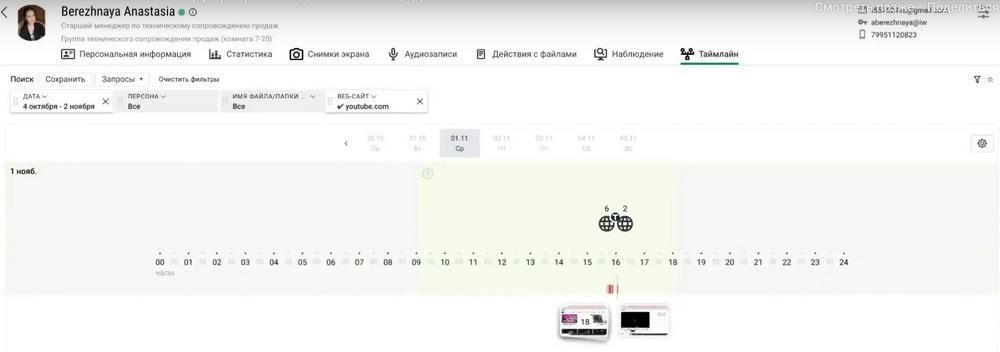
I scale. And in a large scale, events are grouped and, to dig down to the focus point of these events, you just need to use the toolkit by simply clicking on the grouping. And it breaks down.
The interactive timeline is located in the "Observations" section. And when you click on any employee, we can open and go to the timeline. Here we see that for the current day there are two authorization events and three events of using the website. Let's add applications. Suppose that our current task includes incident investigation, restoring the full picture.
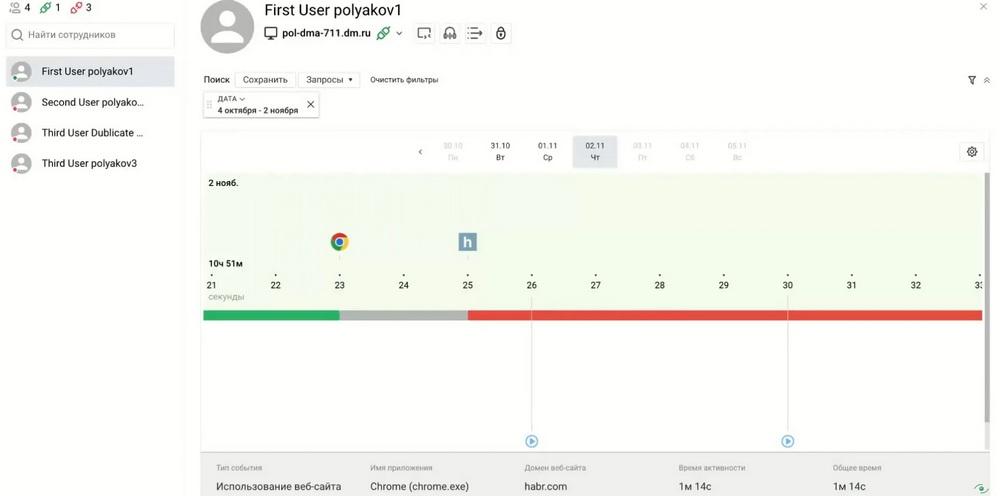
We understand that the DLP system highlighted something in red, some important event. We see that the person unlocked the workstation, used the Chrome application. Some text was entered there, apparently in the address bar. And further we can also look at the screenshots, if we are interested in the details of this text. We see that there was some activity for a while, and then there is website activity. Domain, a standard blank page. Then there was the domain abr of the website, a well-known IT resource and we see that this person, and he, apparently, was already taken under control, there were incidents, there are also audio recordings, they can be easily accessed, they will open in a new player window.
Here the person on Wikipedia has already finished his work and locked the page. Apparently, such a restored sequence will allow us to detail the essence of the incident. It is important to note that at one point in time the timeline contains the details of one working day. There is convenient navigation for moving between days.