Event by OCS and DIS Group, a Russian IT company that offers solutions in data governance, business intelligence, information security, and also provides consulting and implementation of projects in these areas. The event will provide an overview of the main use cases, capabilities of the tool from the perspective of users and administrators of the solution.
Speaker: Alexander Rabotaev, Technical Manager, DIS Group.
Today we will talk about cooperative data management, about the solutions we offer in this area. Our company has been on the market for a long time, 18 years we have been on the market. We are engaged in data management both in terms of projects and in terms of software.
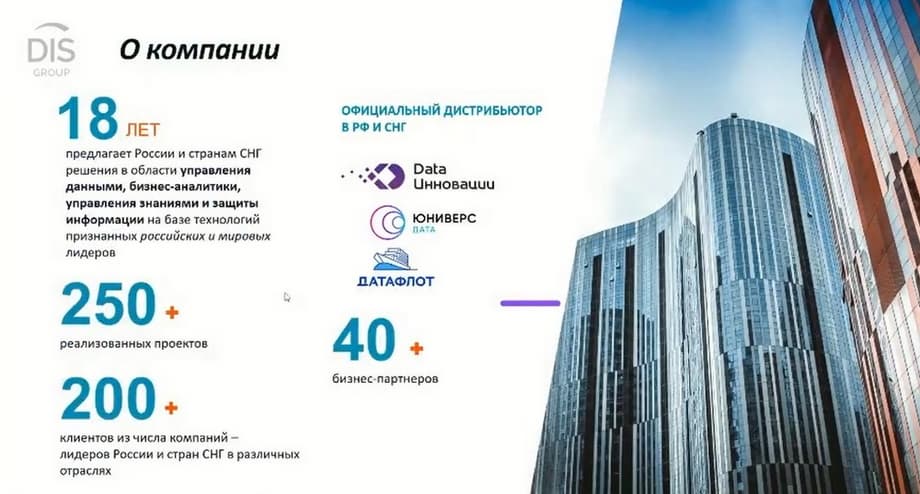
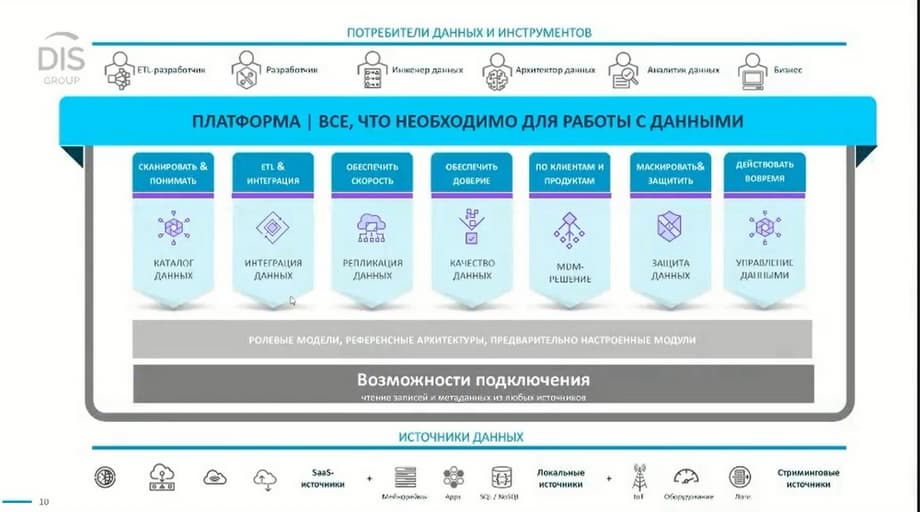
We have worked with Informatica software for a long time. And now we have switched to Russian solutions, we offer Data Innovation, Universe Data and DATAFLEET solutions. We have completed a large number of projects independently, a large number of projects - with partners. Our company is very diverse, from different market sectors. These include financial organizations, telecommunications, retail, and industrial companies, including oil and gas companies. We take on any projects in the field of data management and data integration, master data management solutions. We implement these solutions on the platform we offer, i.e. these are the main components responsible for data management. This is, I repeat, data integration, data quality assurance solutions, master data solutions, and data management solutions, which include a business glossary and data catalog.
Why has data management become such a fashionable and popular topic lately? Because now customers have a large number of different programs and areas to solve different tasks.
Data management is a strategic task for organizations: modern provision of users with data, data must be accessible, secure and reliable, users should not have to search for them themselves or assess the quality of data.
The stack usually includes several units, dozens, or even hundreds of different systems that contain different data for large customers. And it would be good to use this data not only within this system. There is a lot of data, and over time it becomes increasingly difficult to understand where the data is located. That is, there is no single system that, firstly, would allow you to find the necessary information, and, secondly, more and more people are using this data, many BI tools, some other applications offer work in service mode, and it is difficult for a person unfamiliar with a specific system to understand where a particular data set is located, who is responsible for it, how to get access, what is the quality of the data, where it comes from.
And a data management tool is used to solve all these tasks. They allow you to quickly and conveniently either provide users with information, it depends on the project approach, how data work is accepted in the organization, it is either a special department that can provide the necessary information upon request from the user. They have a tool, they know how to use it, quickly find the necessary sets and provide information to the user. Or it can be independent work of the user with this tool, because it allows you to easily and simply search for the necessary information from the point of view of the business component. A person can simply say: "I want to understand what our income is and where it is located." This tool allows the system to understand what income, revenue, or profit is, and in which systems this information is located. What reports are related to these terms, how all this is formed. At the same time, the data management tool allows you to avoid the need for users to "go" to some source systems themselves, search for where this or that information is located, and try to get access to it.
This speeds up the solution of routine tasks. We had examples when customers, when implementing a data management tool, conducted the following experiment. Two people solve the same task with our tool and without using it, in the classical, previous way. The time gain was dozens of times. if a standard analyst enters all systems, searches for some data sets, he may have to get access, assess the quality. This usually takes a lot of time, up to a week. If we use a data management tool, the time is reduced to several hours. That is, the time gain is obvious, and at the same time you can get additional information about data quality. Thus, this tool has become popular and fashionable lately.
The next slide shows the key elements of Data Governance.
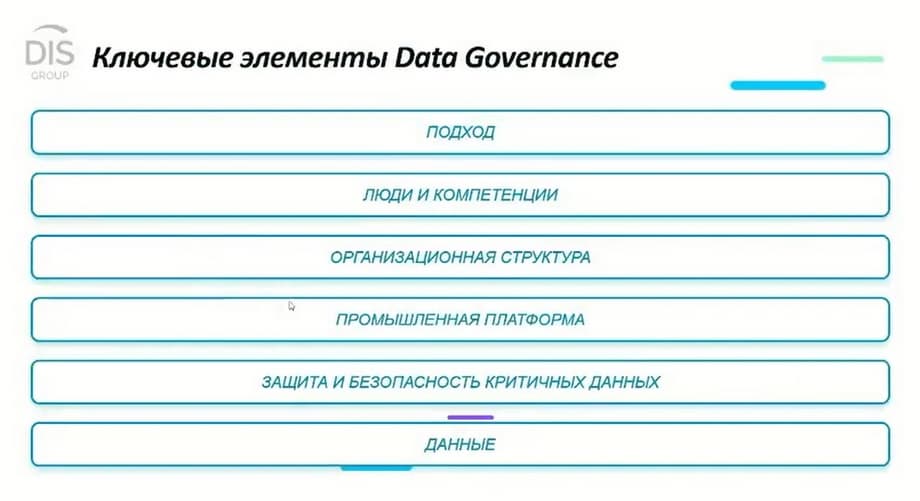
If we talk about the data management elements themselves, then here, if we talk about projects, about implementation at the customer's site, then, unfortunately, you can't just use the tool. Platforms that allow you to find the necessary data and somehow implement the management practice are not enough. A certain approach must be used, appropriate business processes must be implemented, and some changes in the organizational structure will most likely be required. All this is also an important element in data management.
Appropriate processes must be established, and, even if not global, small changes must be made to the organizational structure. Although in large organizations, special departments are usually created for this, which are responsible for data management, there is a Chief Data Officer (CDO), there are data stewards. But at a minimum, there should be dedicated roles in related departments in order to manage such processes. I want to emphasize that you can't just buy a box and use it. Some preliminary survey is always required, a small project with your or our help, which will allow you to build the necessary processes, introduce the necessary changes in the organizational structure, and develop methodological approaches.
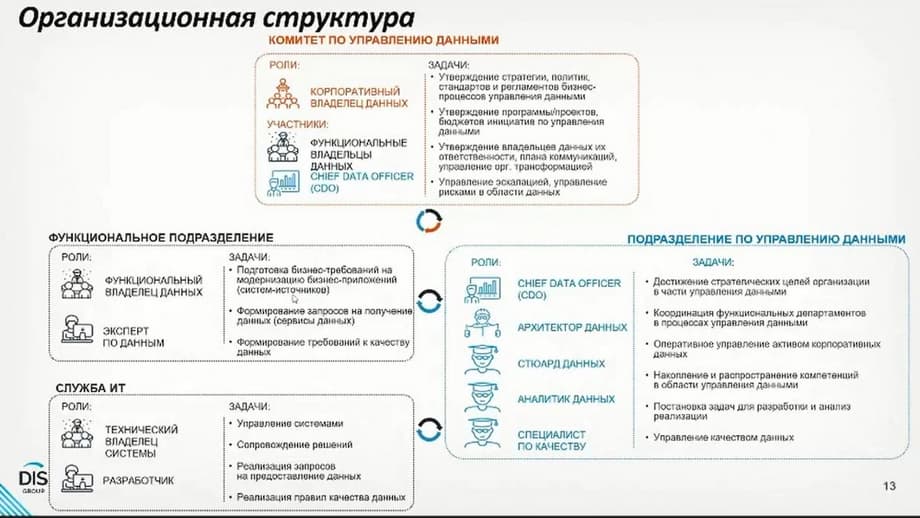
Let's talk about the key elements. The slide shows the global organizational structure for a large company, when there is a data management committee, there is a corporate data owner, there are functional data owners. The Chief Data Officer is also included in this committee. There is a data management strategy, policies, and standards. All this is important. Although in small organizations, it may be redundant. But this is the right approach, when even contracts for data quality are created. For example, when one department provides data to another, it is not just transferred from one system to another, they also sign a document stating what the quality of the data should be, not less than a certain percentage. And such stories are found in different organizations. It is important that business units are confident that they are provided with correct and high-quality data on a regular basis.
The data management committee has the role of Chief Data Officer, who usually has a data management department under his supervision. It may include data architects who are responsible for developing data layers, integration flows, data stewards who are responsible for describing business glossaries, analysts who may be located in functional departments or in the IT service, and a quality specialist. This does not have to be a separate department. And all these roles solve their specific tasks of describing data sets so that other users can quickly find the data they need, of maintaining a register of quality checks to show that the data is not just stored in this system, but they can be sure that it is up-to-date and reliable.
Departments that are users of this system and these processes can use it in different ways. It happens that the system is used by the entire organization, when a user from any department can log in and independently search for some indicator. But this does not happen often. More often, the user is included in the standard application system.
He writes, for example, such a request: "I want to find a data set that corresponds to my business expectations." This request goes to the data management department. There is a user who knows how to work with the tools, and he forms an answer based on the information that was in the application. This is a standard approach in large organizations. Because business users usually don't have time to study a new system, it is easier for them to assign a task to a specialist and get a qualified answer.
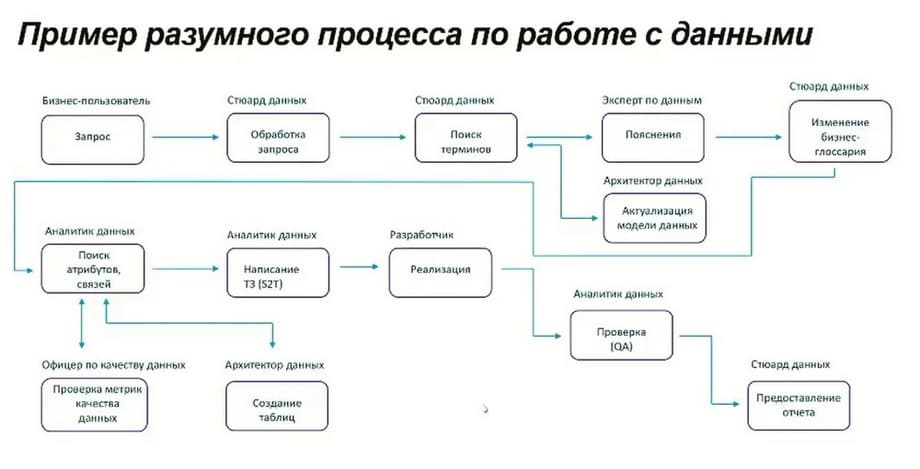
This slide shows an example of this process. A business user writes some request in the application management system that is familiar to him. This request goes to the data steward, who already works with the data management tool, he processes the request, searches for the necessary terms. If he cannot find them, he turns to data experts to collect explanations. The data architect must update the model within the framework of this business user's request. If necessary, business glossaries can be used if the information that was available is not enough. Or he goes directly to the data analyst, who, based on the connections between the business glossary and the data in the systems, will find the necessary attributes and check their quality. A data quality officer may be involved. But this is a conditional division. In principle, all this can be done by one person who is responsible for all these processes.
If necessary, if this request from the business user initially implies that a new indicator needs to be added to change the structure of the showcase, then the data architect is involved, who creates the corresponding tables. After that, the analyst creates the TOR for implementation, the developer implements it. After that the analyst checks whether everything has been implemented, and the data steward provides a report on the execution of the request. And the business user receives information that, for example, a new indicator has been added to the report. This is a complex process.
It's easier when a business user sends some request, for example: "How is such and such an indicator calculated?" Then the data steward goes to the management tool, finds the information and provides information on this request. In this case, the business user can also use the tool himself and find the necessary information. That is, this is a process from the point of view of adding new functions, new terms, or recalculating indicators, this is a process of working with data.
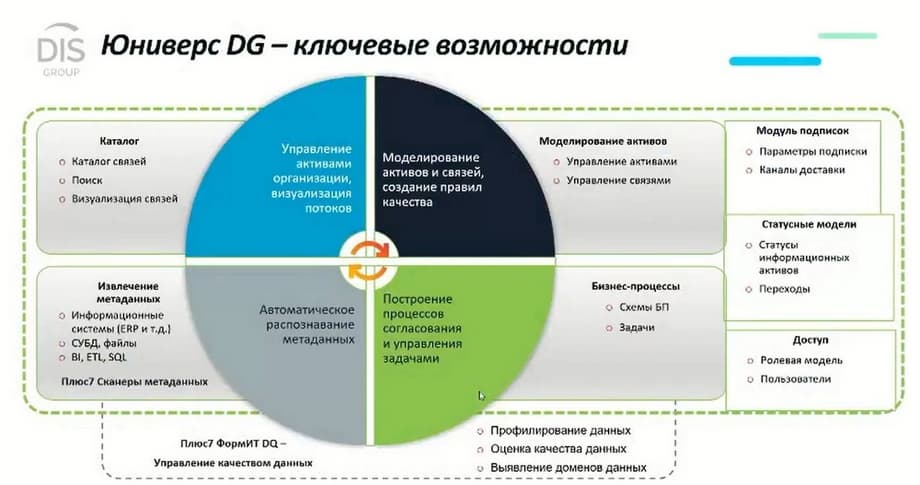
We have talked about the organizational structure, about the methodology of the tool. Now let's talk about the capabilities of the Universe DG tool itself. This is a classic data management tool that includes a business glossary. This is a description of various terms, reports, performance indicators, organizational structures, policies, processes, and so on. It is not limited to any specific objects. Depending on the customer's tasks, these can be different objects. Business glossaries are conceptually different levels, when we describe the concepts that the organization uses, and how these concepts are related to each other. All this allows you to build connections between various concepts within the tool. For example, we have the concept of "client", there is an idea of how it is related to the contract, what a contract is. Different organizations have different definitions of the concept of "client" even within different departments. For example, we had a project at Sberbank, there were 46 definitions of "client" in different departments. Someone considers potential clients, someone considers that this is the client who has a contract. All this terminology is brought together, and due to this, there is an understanding of where the objects are located.
The next thing that the tool allows you to do is to describe logical objects, data sets. A client, for example, took out a loan. It is described by such attributes. And a client in telecommunications is described by other attributes. All this can be configured and modeled in the form that the customer needs. Linking the business glossary with logical structures. The tool also allows you to connect to physical databases, physical applications at the level of tables, attributes, read metadata that exists in real systems. For this, there are special scanners that can read metadata and catalog it. These are two large conceptual blocks: a business glossary, where we keep all kinds of descriptions, a logical model, and a data catalog, which is responsible for collecting information from real tables, real showcases, and cataloging them. Connections are built on the basis of the collected data. For example, in which table is information about clients located. The user can work with the tool in different ways. He can find the concept of "client". Say, the concept of "client" is included in such and such a system, is used in such and such tables. This allows you to immediately understand if he needs to collect a new showcase, where the client is located, if he did not know this before. And in the opposite direction, a system analyst can find a table in the database or in the application and see that this table contains information about the client. This works in both directions, for different roles.
The tool itself includes the ability to build a reconciliation process. In addition to the platform, appropriate processes must be established. In data management projects, the very concept of data management and reconciliation processes plays an important role. Because from a conceptual point of view, it would be wrong if any user had the ability to make any changes. Any changes must be agreed upon by all interested parties. And for this, there is the possibility of building business processes in the tool settings. All this is done through a special designer. It is easy to configure. Everything is done through the settings interface. It is possible to add your own modules and program. But most of the tasks can always be solved in standard ways.
There is the possibility of visualizing data quality checks and their profiling. Above all this, there is a role model, a status model, there are opportunities to work with subscriptions. This is a full-fledged tool that covers all data management tasks from the point of view of platforms. Building a business glossary, building connections between different levels, checking the quality of maintaining registers - all this is covered by the tool in almost a single window.
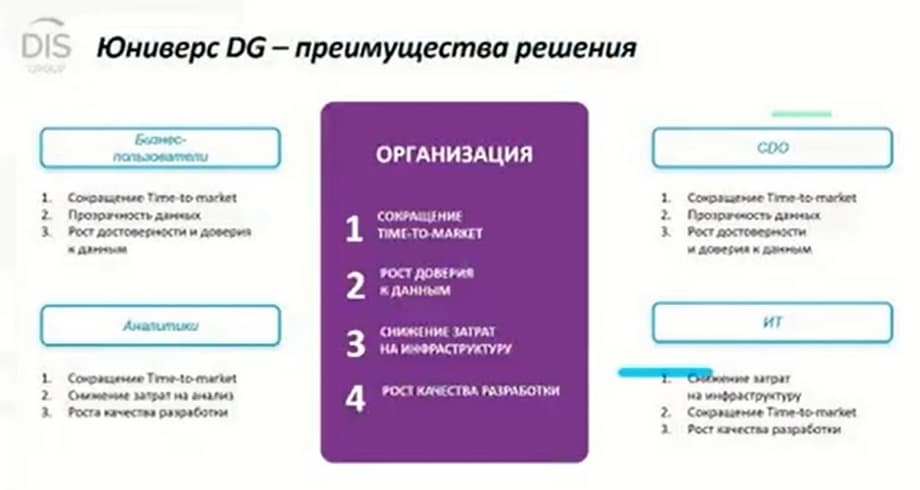
The main advantage is the reduction of time to market, that is, reducing the time to solve routine tasks of searching for where the data is located, what is their quality, how they are connected.
In addition, there is a growing trust in the data. For example, in addition to written reports, you can view quality metrics and immediately see which checks were performed. Plus, there are opportunities to investigate various incidents, when connections between systems are established, and if for some reason a report raises doubts, you can immediately understand from which data it was taken, which systems are the sources of this report. You can go to the cards of these systems and check the quality check results. Maybe there was some kind of failure today. You can immediately see the person responsible and the owner of these systems, contact them, and understand what happened as a result.