At the online meeting, Vadim Zhirnov, Architect of Engineering Systems at Systeme Electric, provided detailed information about the SystemeDC product ecosystem. He also shared the advantages of focusing on a single manufacturer and the benefits of a "one-stop shop" for service maintenance.
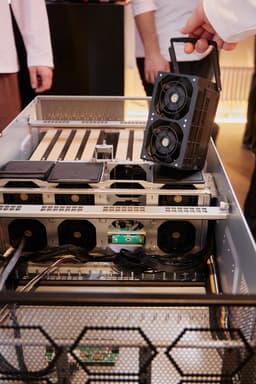
He began with information about the Systeme Electric hardware portfolio – the successor to Schneider Electric and APC in Russia. After the departure, Schneider left three factories. Accordingly, the entire team, which is 3,500 people, was successfully retained. We are now manufacturing some of the "hardware" ourselves, and at the moment we have restored almost the entire product offering that Schneider and APC had.
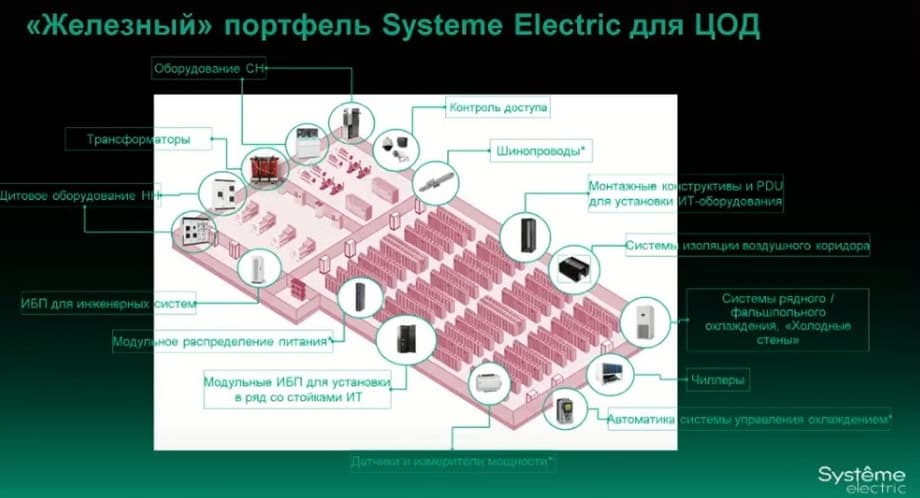
The Schneider Electric product portfolio allows data centers to be built on a mono-vendor basis. That is, we have a part that usually relates to the building, i.e., "medium voltage": cells, transformers, low voltage, this is switchgear, panel, modular equipment. And directly that part that my department deals with is IT solutions. These are uninterruptible power supplies, single-phase, three-phase power distribution units, cabinets and mounting structures, containerization systems, and other equipment. Today I would like to talk in detail about the ecosystem. In the current realities, it is not enough to just sell equipment, you also need to provide technical support or services. One important aspect that makes products an ecosystem is services.
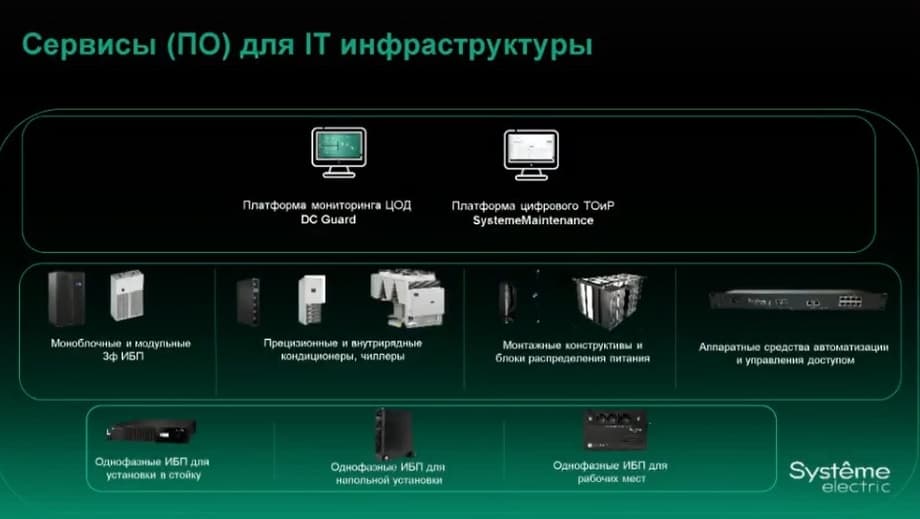
Today I will talk about the DCGuard data center monitoring platform. This product is the successor to DataCenterExpert from APC. And another service is the SystemeMaintenance digital platform for maintenance and repair (MRO). These two products allow you to combine all hardware devices into a single ecosystem and integrate them with each other. Our task was not just to repeat what was, but to form a different set of functionalities.
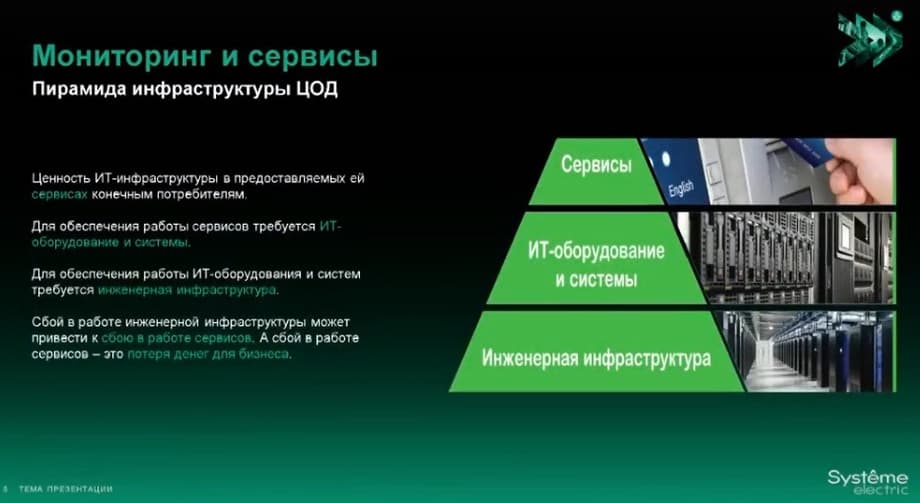
A data center is an engineering infrastructure - it's UPS, air conditioners, power distribution units, then IT equipment, i.e. servers, storage systems, and services, these are applications, for example, banking, and so on. If some service goes down, the business loses money. Why can this happen? Because either there was a failure on the IT equipment or on the engineering infrastructure.
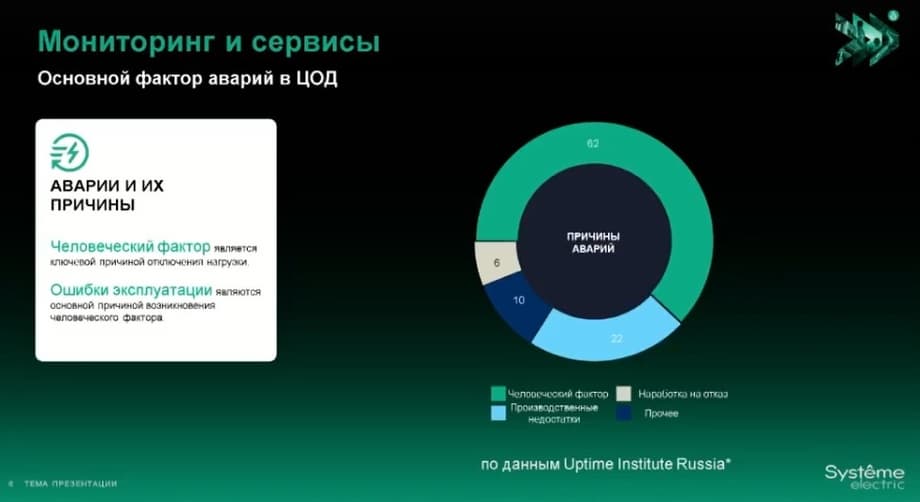
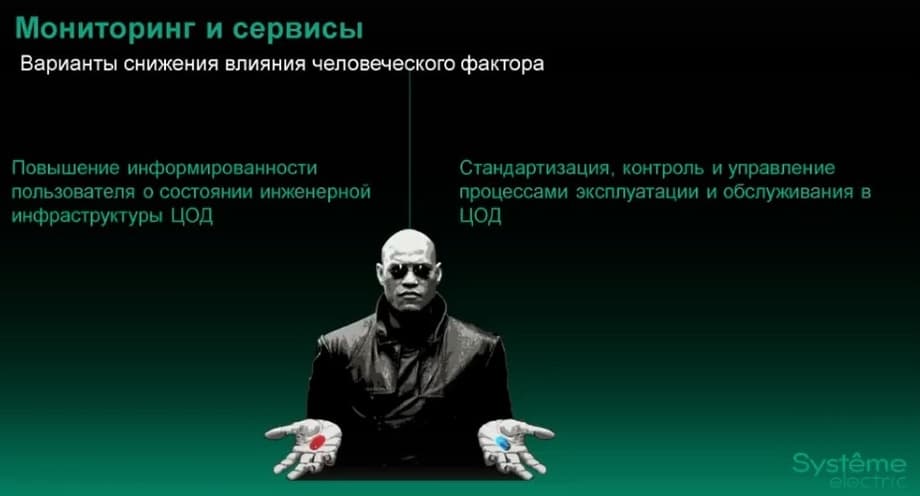
From 60 to 80% of failures in data centers are due to human factor or operational errors. And the main question arises, what to do with the person? The first, most basic option is to simply remove the person from the operation processes of data processing centers. This is a good option, but it is not an option for the coming years.
In essence, there remain two other options: to increase the user's awareness of the state of the engineering infrastructure. That is, to be informed is to be armed. If you notice in time, if the system highlights in time, then there is time to react. And the second element is a certain standardization, control, and management of the operation process. That is, when everyone does everything the same: typical installations, maintained identically, the same parameters are checked during the bypass, at a certain time, then, accordingly, this allows, so to speak, to stop the person from inventing something that could lead to an error. And, in fact, it was based on these two paradigms that our products were created.
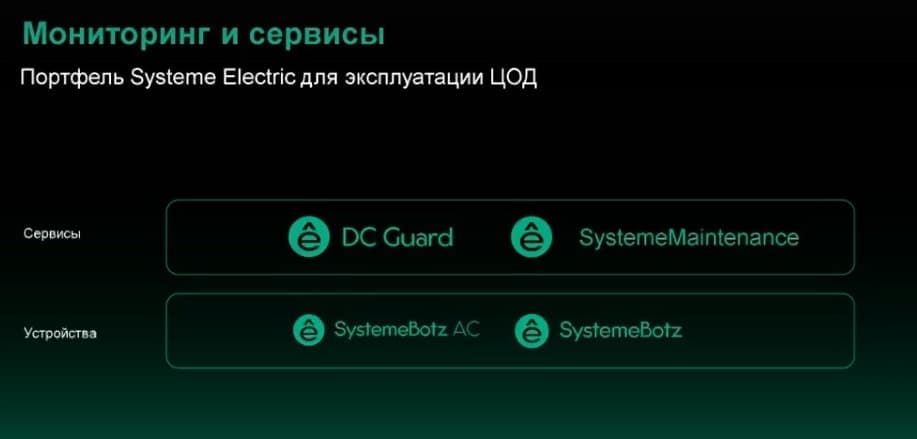
Today I will talk about the DCGuard platform, which increases user awareness, and about the SystemeMaintenance software product, which helps to standardize processes.
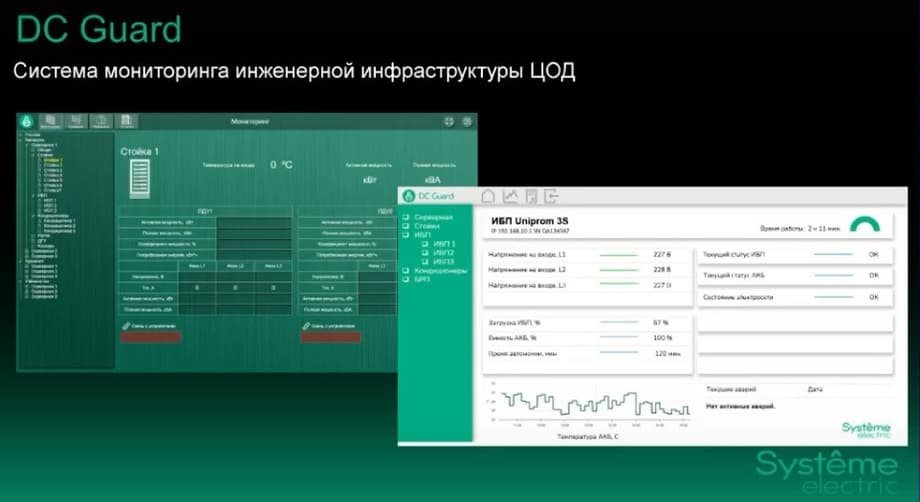
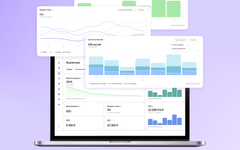
They are very specific to data centers and DCGuard. I suggest starting with the DCGuard data center engineering infrastructure monitoring system. This system allows you to increase user awareness. This is what the current typical system interface looks like. We plan to make some interface updates by the end of the year, it will be a little more beautiful and universal. I will talk about the ideology of the system.
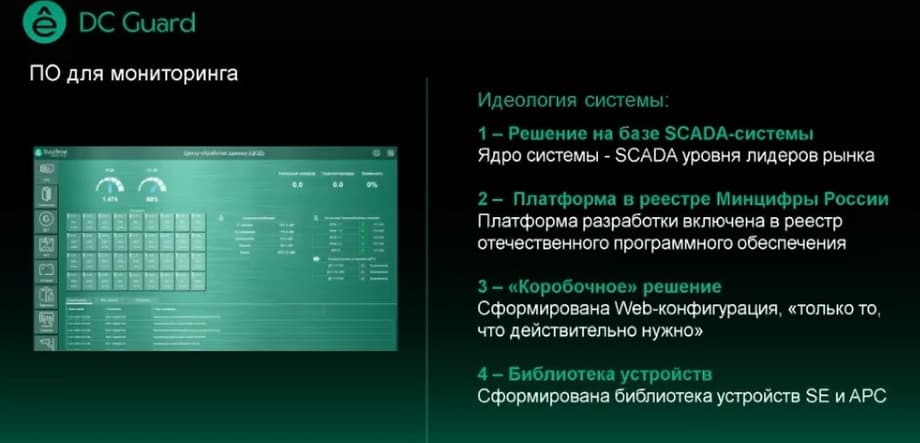
First, this is a solution based on a SCADA system, the core of the system is a SCADA from market leaders. The development platform itself is registered by the Ministry of Digital Development in the register of domestic software. But the important point is that this is not just SCADA, but this is a conditionally boxed solution. That is, we have formed a certain configuration, which includes the most necessary things.
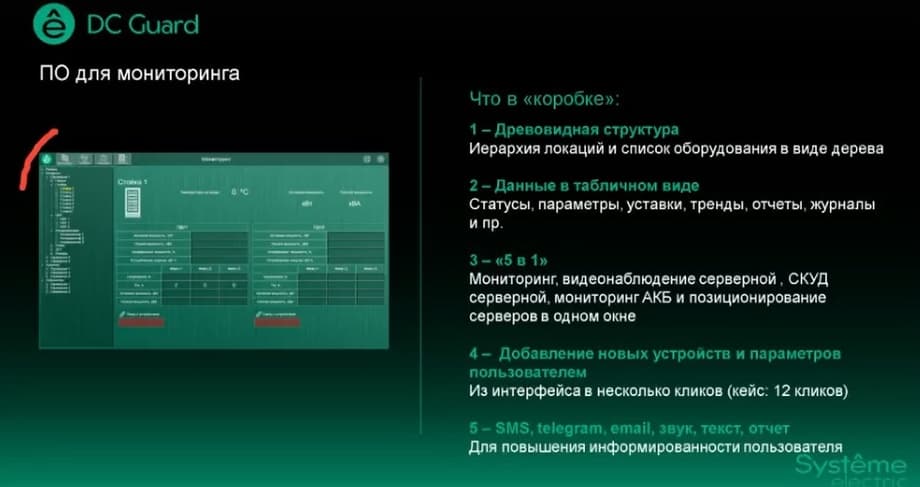
And we added devices to this box in the library. At the moment there are all Systeme Electric devices, Schneider Electric and APC devices. What's in the box? First of all, a list of equipment presented in a tree structure that allows you to quickly switch between units of equipment. All data is presented in tabular form. We specifically did not try to create beautiful animations, mnemonic diagrams, and so on. Everything here is simple, clear, and standard. In terms of functionality, the system includes "five in one". A few months ago I said that it was "three in one", now it is "five in one". What's the point? This is primarily monitoring the parameters of engineering equipment: UPS, air conditioners, power distribution units.
Next, we add video surveillance there, that is, cameras that are installed in the server room. These IP cameras can transmit their video stream to the monitoring system. Then we add an access control system there, also not the entire building, but directly the machine room. There is such a solution that allows you to install handles with ACS function in the racks, which can be opened with cards or biometrics. The DС Guard system already has a module implemented that allows you to track the position of doors, control the reader handle, add users there, assign cards to them, for example, and then generate a report on which users, from which rack, at what point gained access.
The next element in the system is monitoring of battery batteries.
We collect data on each battery from our hardware device for battery monitoring. And the fifth element is the positioning of servers. This is such a strip that is installed directly into the rack. It has a label. On the one hand, the label is attached to the strip, on the other hand - to the server. Roughly speaking, when we pull out the server, the system understands that the server is not in the rack. When we insert it back, the system understands that this server is installed in the rack again. In the system, you can keep track of this server, that is, the name and some basic information. This is a system that includes several elements, it is modular. And we give the user access to this system, he can independently add new devices and edit some parameters. As a rule, in SCADA systems you need to either contact the solution provider or take additional complex courses, go to the admin panel in order to add a device. Our solution allows the user to do this independently.
And these are the very elements that increase user awareness — these are SMS, Telegram Bot, email, sound, text, and report. The system allows you to create a small text field opposite each piece of equipment, into which you can enter information about the current composition of the equipment. For example, if it is turned off, then why, by whom, and for what purpose. This greatly facilitates the acceptance and transfer of shifts at the facility itself.
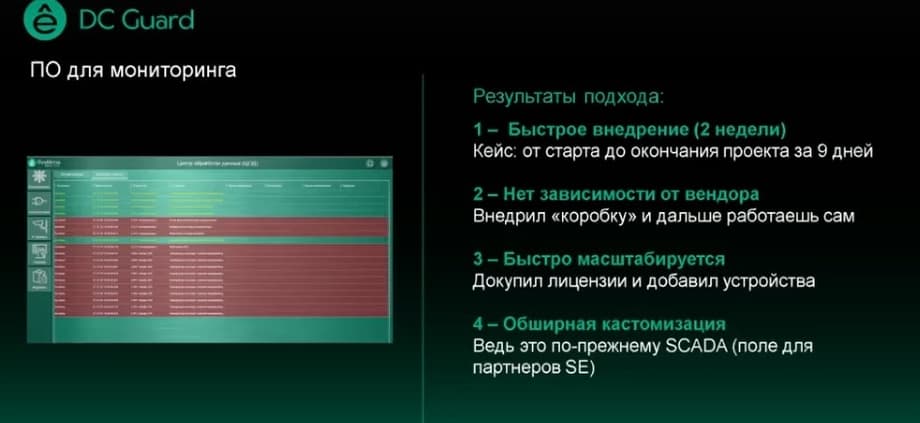
What are the benefits of this solution? Next, the solution based on the SCADA system was packaged in a box, we made limited functionality and saturated the databases of our equipment. And we made additional functionality so that the system combines all our product offerings within the data processing center server. This approach allowed us to move to rapid implementation. That is, if earlier monitoring products were deployed for months, now we do it in two weeks. We have examples of cases when we did it in 7-9 days.
The second element is independence from the vendor. Since we have worked out the functionality so that users can independently add devices, the only task remains is to purchase licenses and add payments themselves. And then you will always be on a stable version. The system allows you to quickly scale. You just need to buy more licenses. And at the same time, since the core of the system is still from SCADA, there remains an extensive field for customization. We can easily add SCADA devices from third-party manufacturers to the system.
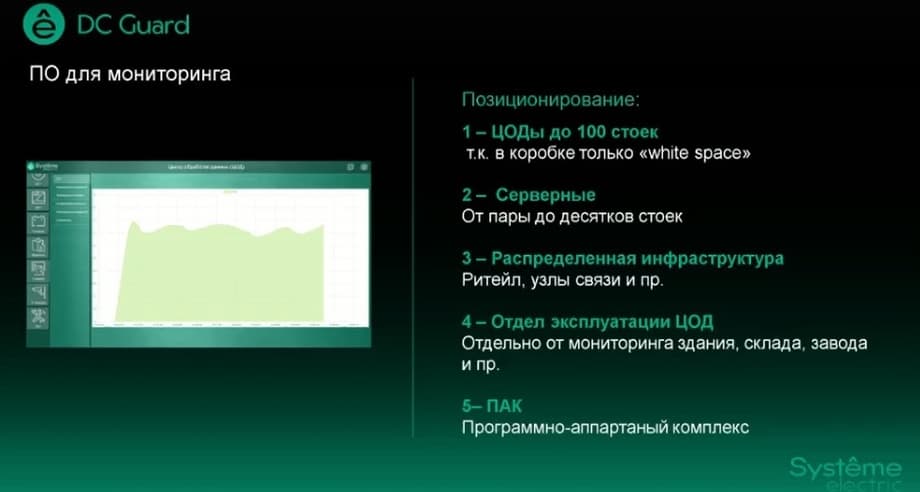
We focus on the segment of small servers, usually no more than 500. Because this allows you to deploy the system in the fastest way. Accordingly, this also includes distributed infrastructure. This is retail, communication nodes, that is, when you have many small racks scattered territorially, but connected to a common network. You can put our DCGuard and collect all the data from distributed nodes.
Data center operation department. Often there are tasks when there is a large industrial facility and a small server room inside. It often happens that the people who are responsible for the operation or for the operation of the building and the small data center are different people. Those who are responsible for the building look at one SCADA system, and those who look after the data center need their own place to look, their own workstation. And, accordingly, they look at our system, because everything is in one place there.
We can comprehensively address the customer's task regarding the monitoring system. And accordingly, if it is our equipment, it is already entered into the database, which allows for quick deployment of the system.
1
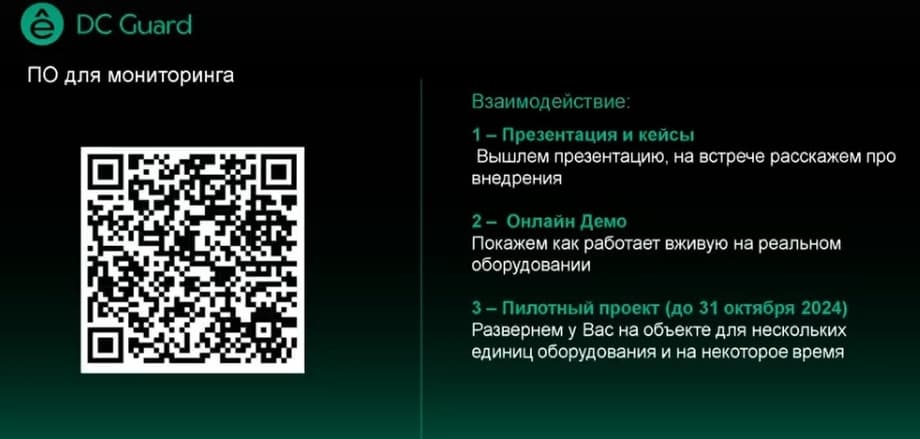
We conduct a pilot project, that is, we deploy the system for free on the customer's infrastructure, naturally, with a limited amount of time and a limited number of devices. And we show how the system works. The customer can work in the system themselves, see what it is, and understand everything in more detail.
Now we have talked about the DCGuard monitoring system. Its goal is to increase user awareness of the state of the engineering infrastructure. In this way, we combat the largest number of failures due to human error. Accordingly, the second element is the standardization of control and management of the operation process.
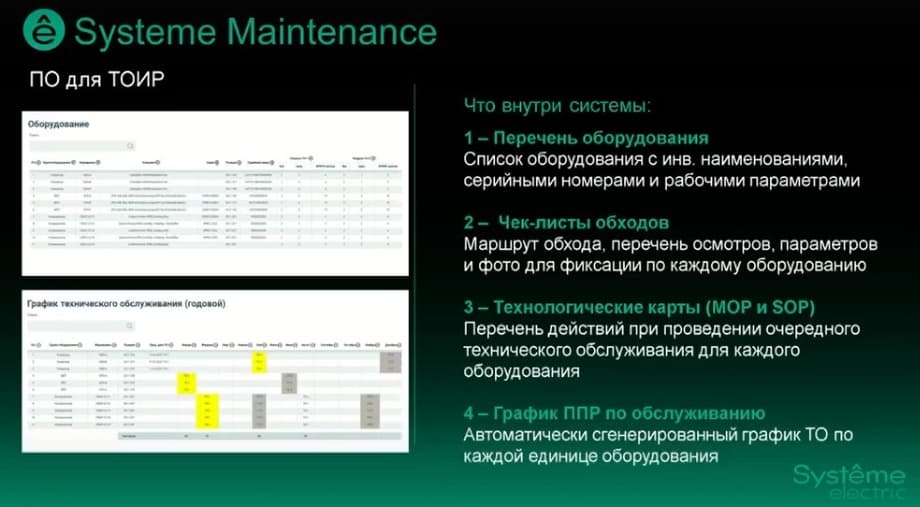
For these purposes, we have a separate product - this is a CMMS (computerized maintenance management system) class system. Imagine, we come to your facility and collect a list of equipment with inventory numbers, operating characteristics, etc. Then we offer to create checklists for this equipment, which contain a list of parameters that need to be checked during daily rounds. That is, take some readings, for example, measure some temperature, or simply check if there are any unauthorized persons on the site, etc. Then we offer to add technological maps or a list of actions to this equipment that are necessary for maintenance. We will add information about what tools and materials need to be taken for maintenance, how much time it will take, who exactly can perform this work, and what specific actions need to be performed. Based on this information, we will create a schedule of planned preventive maintenance. And we will enter all this into the system. And what will we get in the end?
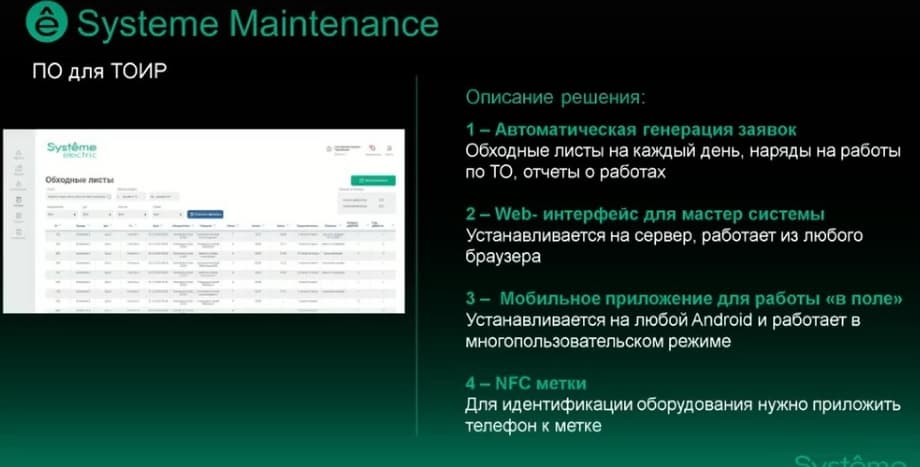
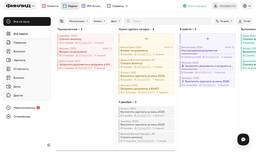
We will get that in the morning, when coming to work, for example, the chief engineer and the direct executor will know what to do today. The direct executor, as it usually happens, comes to work, he has a mobile phone, he opens it and sees that he has, for example, two rounds and three maintenance services for today. He presses the "start round" button, and the system tells him to go to such and such equipment, check such and such a list of parameters, take a photo, and record it. And a similar story with maintenance. The system tells him: "Take such and such materials, such and such tools, go to such and such equipment and check this list of parameters."
Upon completion of this round and upon completion of maintenance, if the system has recorded an exit beyond the permissible limits of some parameters, a certain defect is automatically formed in the system, that is, some malfunction in the operation of the equipment. And here the second character (the first is the executor, and the second is the chief engineer) immediately, as soon as the round is completed or the maintenance is completed, he will immediately see the results of these works in the system, sitting already at the computer. And he will see if any defects have been formed, what photos are available, what parameters have been taken, how many materials have been spent, how much time was required for the rounds. And thus he will get complete statistics on what is happening. Plus a work schedule for the near future so that you can coordinate work with customers or to organize your own resources. Thus, after working in the system for some time, you will have a complete understanding of how much time and how many resources you need to carry out the work, what materials and in what quantity you spend.
You can upload reports on defects and incidents, you can see the dynamics of changes in its parameters from month to month for each unit of equipment and compare it with the parameters on other equipment. That is, if we have some pump that has a bearing starting to heat up, and there are 10 such pumps, then we understand that this may happen with other pumps. And then, perhaps, we will need to carry out work to replace the bearings on all pumps at once.
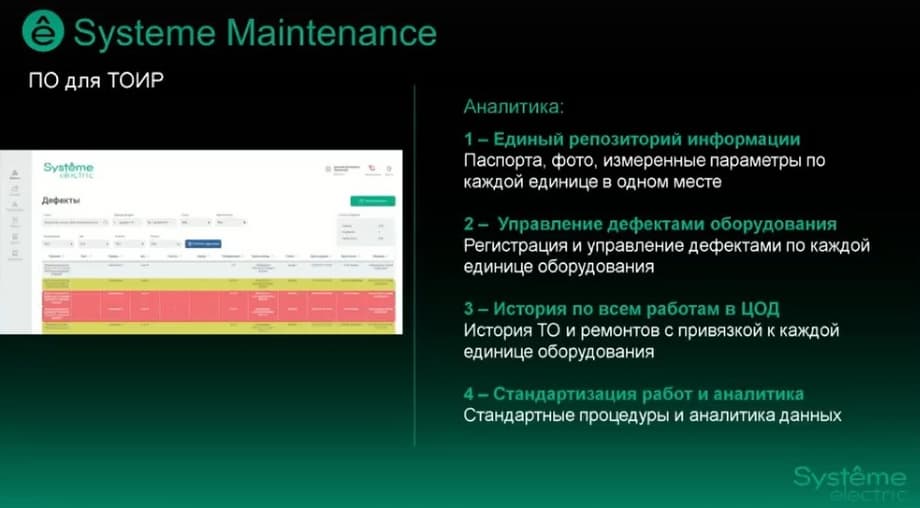
If we talk in more detail, then we get a single repository of information, equipment defect management, history of all works in the data center, that is, the entire list of rounds and maintenance will be saved for each unit of equipment, and this will lead to standardization of work and obtaining analytics. Everyone will act according to the instructions, the instructions can be corrected in accordance with the practices that will be applied in the data processing center. And thus the work of all employees will be standardized.
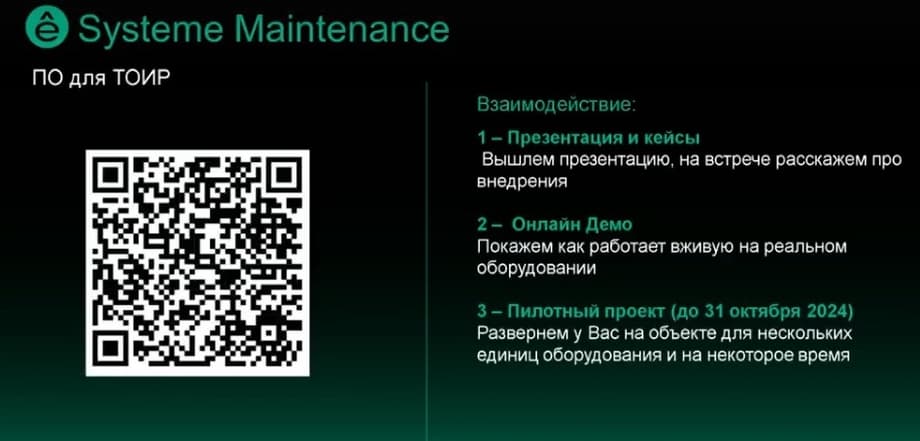
We have an online demo, we can show this system live, how it works. Accordingly, together with the mobile application. And we have the opportunity to conduct a pilot project, again, just like the monitoring system. That is, we can deploy our system on a certain number of devices, and you will try to work with it for some time, and see how it is actually implemented.
I want to say that these two products, since our hardware devices are integrated into the monitoring system, and the maintenance and repair system has a list of checklists and technological maps for our equipment, this allows us to create a certain ecosystem in which we have not only hardware products, but also software products that actually create this ecosystem.
And now we move on to some specific devices that are part of the ecosystem for data centers and server rooms. These are devices for monitoring environmental parameters. Those who are familiar with the APC offer know its solution as on And Pods. This is its successor, a device that we produce here locally in Russia, and the web interface is also written by our programmers. What's the point? Roughly speaking, we have a data processing center, and a lot of engineering equipment. We collect temperature and humidity from air conditioners and a lot of other things. But the most important element remains - a specific rack. As a rule, we do not know what the real temperature is at the entrance to a specific rack, what the humidity is there, whether there is a leak under this rack, whether its doors are open or closed.
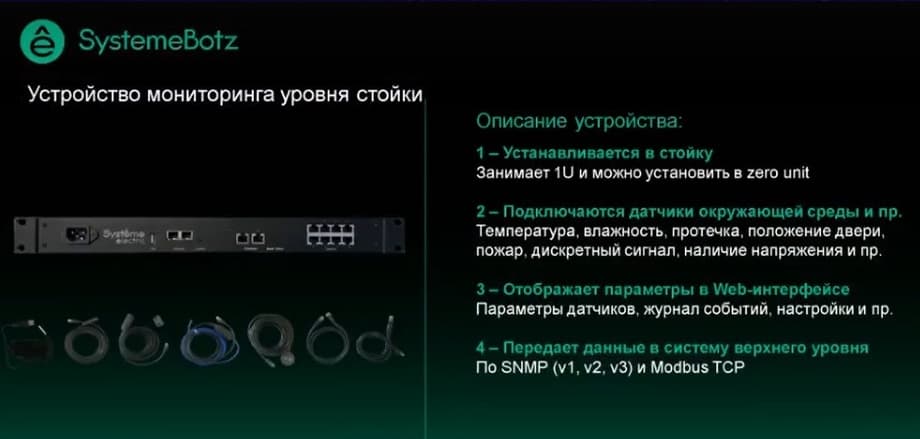
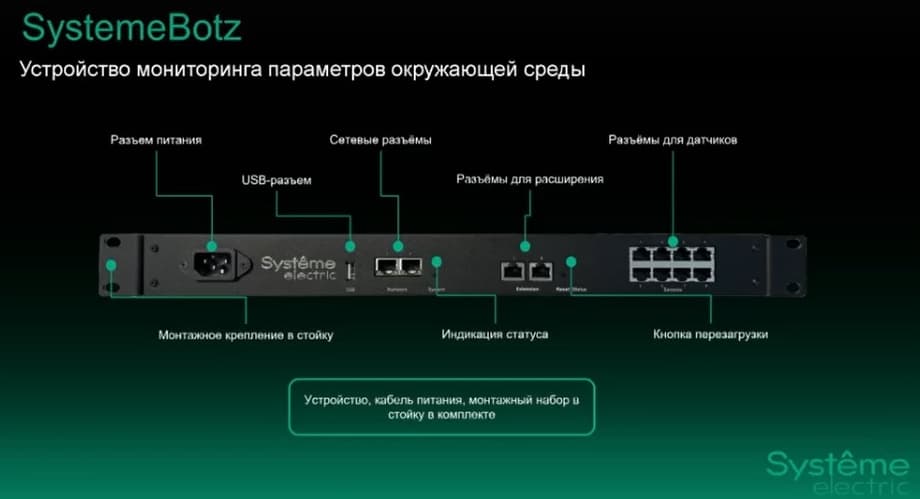
Just for these purposes, there is a separate environmental monitoring device SystemeBotz. What is it? In fact, it is a device that is installed in a rack, it takes either one unit, or is placed zerounit if the rack is wide, just on the side. Accordingly, environmental sensors are connected to it. These are temperature sensors, humidity sensors, tape leak sensors, point leak sensors, door position sensors, fire sensors (fire alarm). And there is also little automation: a discrete signal and the presence of voltage. These sensors are connected simply by an RG-45 connector to one of the eight connectors on the device itself and are determined automatically. That is, in fact, the entire installation of the device is reduced to fastening four bolts on the device's ears. So, we screwed on 4 bolts, inserted 8 sensors into the RG-45 connectors, and the device itself determined what these sensors are and began to show their parameters. We see all these parameters in the web interface of the device and can transfer them to the upper-level system, for example, the DCGuard centralized monitoring system via SNMP, and we support version 1, version 2, version 3.
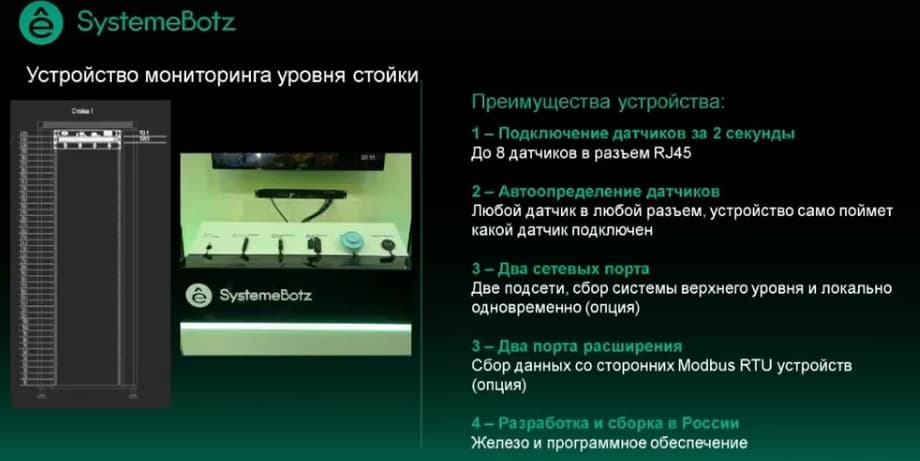
The sensors are connected in literally 2 seconds, are determined automatically, the device has 2 network ports, that is, you can simultaneously transmit data to the upper level and connect locally, there is an option. There are 2 expansion ports, you can connect either external devices or use them for the expansion module of this device, which we should release by the end of the year. The hardware and software are developed and assembled in Russia.
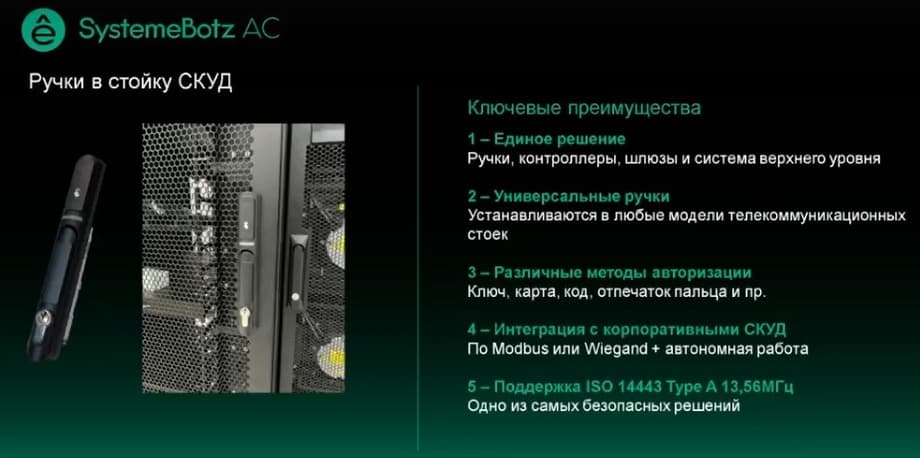
And one more device, also a specific offer, also part of our ecostructure - these are handles with an access control function in racks. I talked about them earlier when I talked about the monitoring system. In the usual mounting locations of rack handles, you can insert a handle that has a controller and reader inside. Thus, you can restrict access to this rack. That is, in order to get into the rack, the user must have a card that is registered to him, bring it to the rack, the system will check that this card and this user can access this rack. And if possible, it will open the handle, and the user will get access to this rack. The handles are universal, they fit our racks, and are also compatible with some third-party models. There are various methods of authorization. This is a key, a standard card, a code, that is, you can enter a code password, and there is also a fingerprint access function. That is, we enter biometric data in advance, and then you can log in.
The handle works in three modes. The first is autonomous, when there is just one handle with power, we connect to it directly with a cable, tell it which card can be opened for, and it opens. The second is the ability to integrate with a corporate access control system. For example, we have a case of integration with PRK systems, this happens via the industrial protocol Wiegand. And the third option is to work in a single solution. That is, in a single solution, when our handles and our software. This is the DCGuard system, this is a centralized monitoring system with an access control module. If we talk about cards, the handle supports high-frequency standard cards, they are more secure.
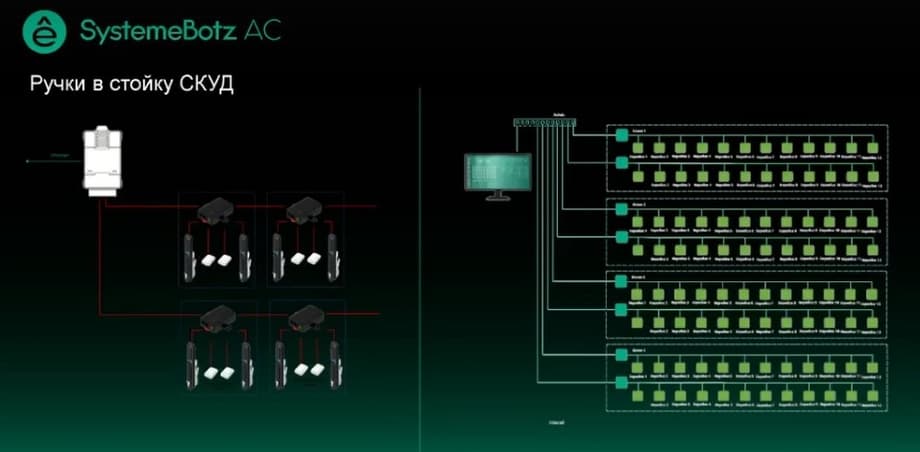
Now about how complex solutions look on our product. What do we have here? This is a handle or two handles, if handles are needed on both sides. If the rear door is double, and there are rods there, then two handles, two reed switches, door position sensors. And there is a small communication unit that simply accumulates all this data. And from this unit we go to the gateway. Thus, we put one gateway on a row or two rows, collect it into a single system, and then after the gateway - a switch and the DCGuard monitoring system with functionality in which we can register cards, create users and see if the door is open or closed. This is how this solution looks.
All illustrations belong to Systeme Electric.